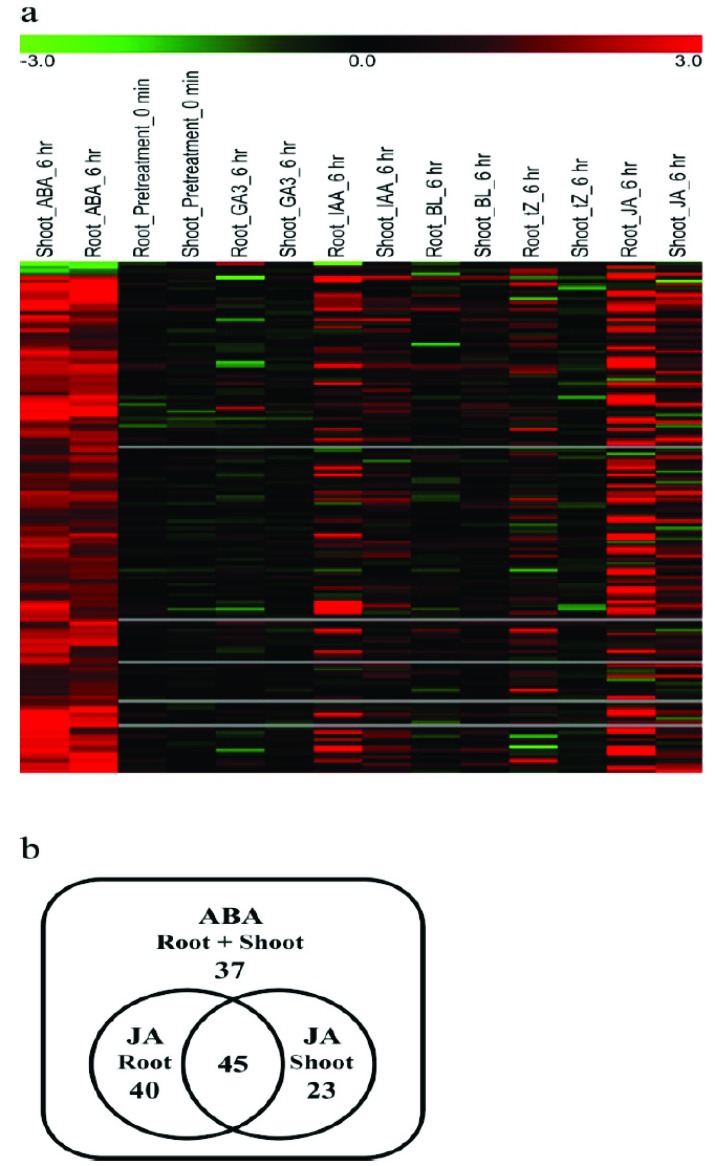
Fig. (3).
Expression profiles of ABA-regulated genes upon treatment with other hormones. a) Heat map analysis of expression profiles under several hormone treatment conditions for the genes that were significantly regulated by ABA in both root and shoot. The genes for which the p value was below 0.05 and expression was changed two-fold both in root and shoot were selected for comparison. b) Venn diagram of ABA- and JA-regulated genes in rice root and shoot. (For interpretation of the references to color in this figure legend, the reader is referred to the web version of this paper.)

