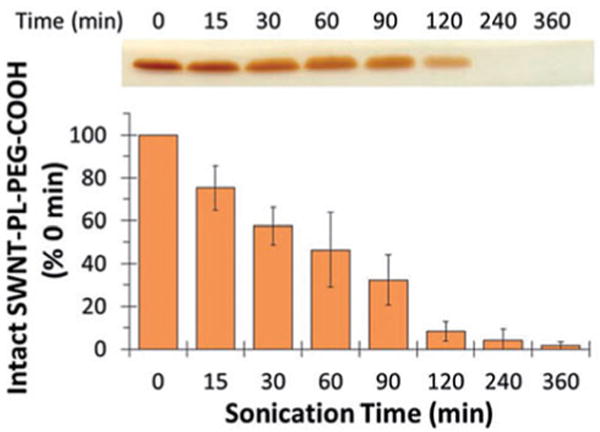
Fig. 4.

Sonolytic degradation of DSPE-PEG-COOH in the presence of SWNTs. 5 mg of SWNTs were sonicated in 10 mL of 0.35 mM DSPE-PEG-COOH for the indicated times. The samples were resolved by SDS-PAGE followed by BaI2 staining and the stained bands are shown at the top of the figure. The gels were then scanned and the band intensities quantified using ImageJ software. The data are presented as % density relative to 0 min as a function of sonication time, shown at the bottom of the figure. Reproduced from Murali et al. 2015 [11] with permission from SAGE Publications
