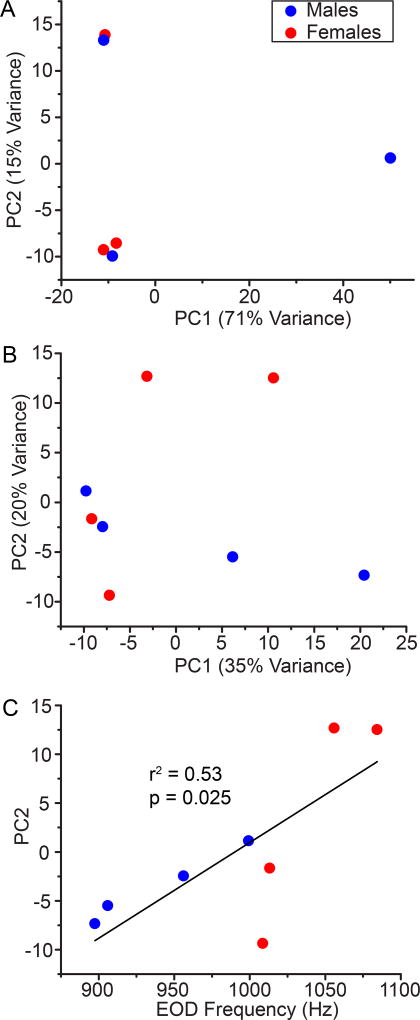
Figure 1.
Principal components (PC) analysis of transcript expression in the Pn of A. leptorhynchus (A) and A. albifrons (B). Each data point represents PCs of expression in one individual (males blue circles, females red squares). Variance explained by each PC indicated in the axis title. Male and female PC values did not segregate cleanly in either species. (C) Correlation between EOD frequency (EODf) and PC2 in A. albifrons.

