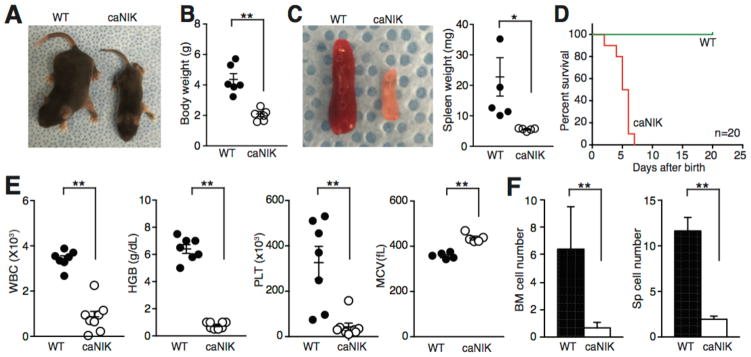
Figure 1. NIK Activation induces postnatal lethality and bone marrow (BM) failure.
(A) Representative images of 5-day-old wild-type (WT) and caNIK mice showing body size. (B) Total body weight of 5-day-old WT and caNIK mice (n=6, p<0.01). (C) Representative images of spleen (left) and the spleen weight (right) of 5-day-old WT and caNIK mice (n=5, p<0.05). (D) Kaplan-Meier survival curve analysis of WT and caNIK mice (n=20, p<0.0001). (E) Complete blood count (CBC) analysis of 5-day-old WT (n=5–7) and caNIK (n=5–8) mice (**p<0.01). WBC, white blood cells; HGB, hemoglobin; MCV, mean corpuscular volume; PLT, platelet. (F) Cellularity of bone marrow (BM, left) and spleen (right) of 5-day-old WT (n=9) and caNIK (n=12) mice (**p<0.01).

