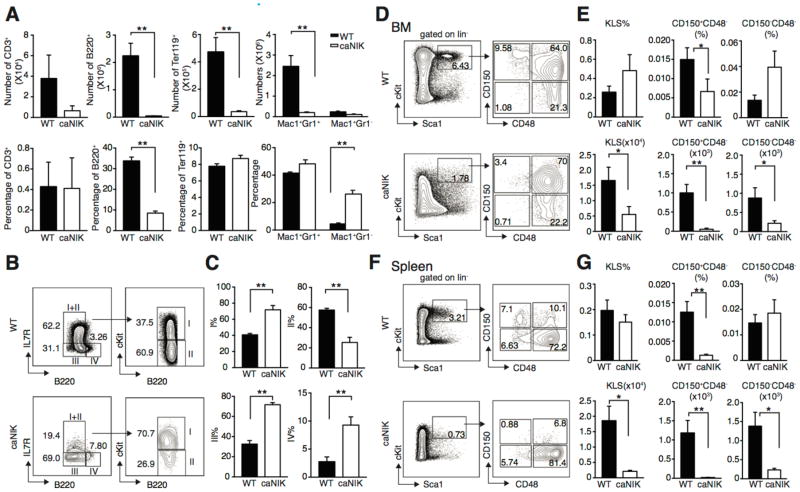
Figure 2. NIK controls lineage commitment and HSPC pool size.
(A) Absolute counts (upper panel) and frequencies (lower panel) of BM CD3+ T cells, B220+ B cells, Ter119+ erythrocytes, Mac1+Gr1− monocytes/macrophages and Mac1+Gr1+ granulocytes in WT or caNIK mice (n=6, **P<0.01). (B, C) Representative fluorescence-activated cell sorting (FACS) plots (B) and frequencies (C) of BM B cells at different developmental stages in WT and caNIK mice: I) prepro-/early pro-B; II) late pro-/early pre-B; III) late pre-/immature B and IV) mature recirculating B (n=3, **p<0.01). (D–G) Representative FACS plots (D, F), frequencies (upper) and absolute numbers (lower) (E, G) of KLS (Lin−cKit+Sca1+) cells, long-term stem cells (CD150+CD48−KLS), and short-term stem cells (CD150−CD48−KLS) from BM (D, E) or spleen (F, G) of 5-day-old WT and caNIK mice (n=10 for BM and n=7 for spleen analysis, *p<0.05, **p<0.01).

