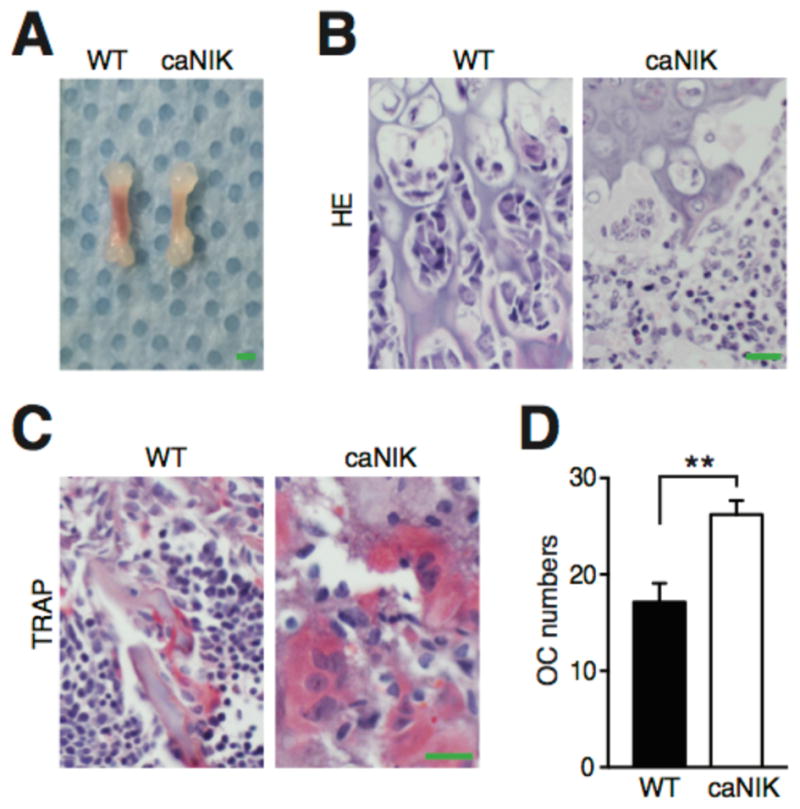
Figure 6. NIK indirectly regulates BM microenvironment.

Representative gross pictures of femurs (A, scale bar 1mm), H&E (B) and TRAP (tartrate resistant acid phosphatase) (C) stains of 5-day-old femurs from WT or caNIK mice (n=5). Scale bar 20 μm in (B) and (C). (D) Average number of osteoclasts with two or more nuclei per cross-section of femur metaphysis of WT or caNIK mice (n=5, two levels of each, *p=0.0024).
