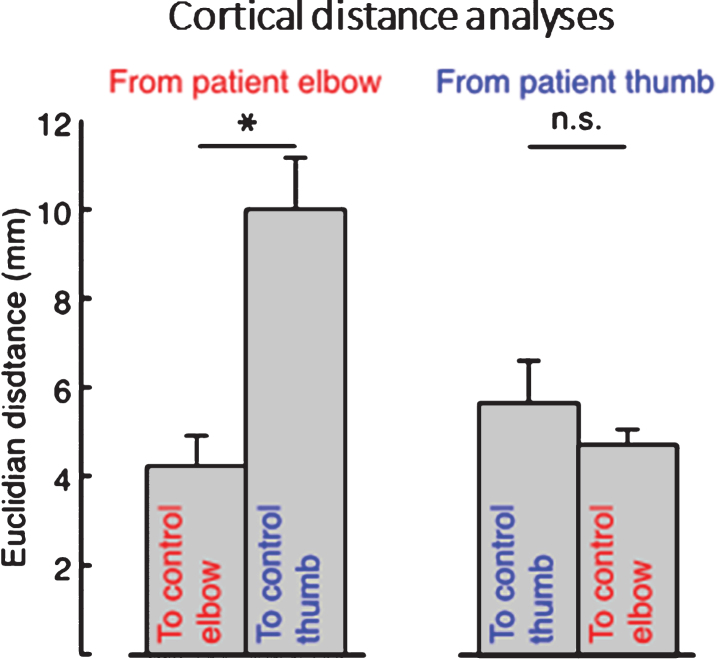
Fig.2.
Average cortical distances between patients’ elbow and thumb flexion activation centers of gravity (CoGs) and control participant’s CoGs, showing that the distance from patient’s elbow CoG to the average control participant’s elbow CoG was significantly smaller than the distance from patient’s elbow CoG to the average control thumb CoG, whereas patient’s thumb CoG was not more near neither the average control’s thumb or elbow CoG. Error bars indicate standard error of the mean. Significance of planned comparisons (one-tailed t-tests) are denoted as follows: *p < 0.05, n.s. p > 0.05.

