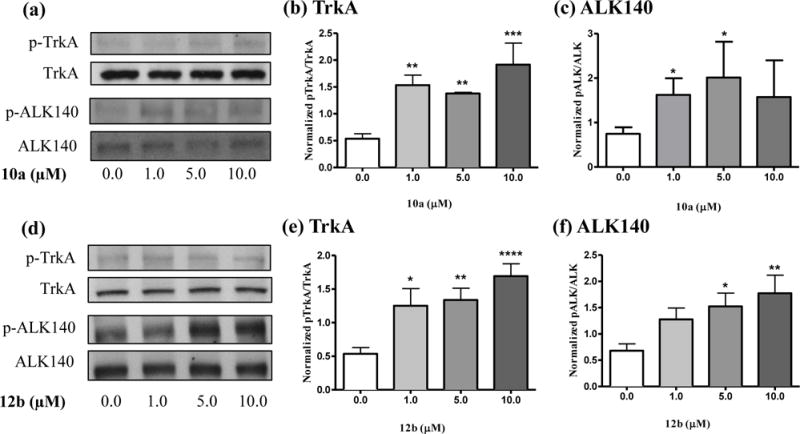
Figure 1.

(a) Representative western blots showing 10a-induced increases in phosphorylated TrkA (pTrkA) and the 140 kDa ALK isoform (pALK). Total TrkA and ALK western blots are shown below each phosphorylated protein blot for comparison. (b–c) Quantification of western blots using ImageJ. (d) Representative western blots showing 12b-induced increases in pTrkA and pALK. Total. (e-f) Quantification of western blots using ImageJ. Data are presented as mean ± S.E.M. *p < 0.05, **p < 0.01, ***p < 0.001, ****p < 0.0001 compared to vehicle controls (0.0 μM).
