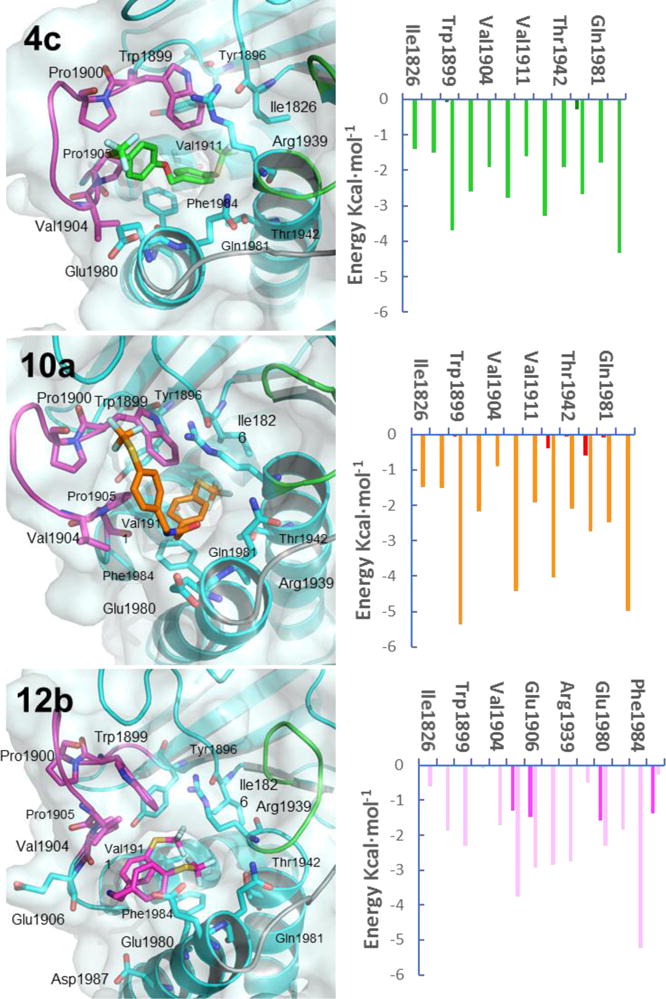
Figure 3.

Proposed binding modes of 4c, 10a and 12b inside PTPRZ1. (Left) PyMOL stick and cartoon representation of the proposed binding modes for 4c, 10a and 12b inside PTPRZ1. Structures shown correspond to the most populated conformations along the MD simulations in the PTPRZ1 superopen conformation. 4c, 10a and 12b are shown in green, orange and light pink sticks, respectively. Residues involved in interactions are shown as sticks. The protein is colored cyan and the active site, WPD-loop and Q-loop are highlighted in green, magenta and grey, respectively. (Right) Per-residue energy decomposition of each complex with PTPRZ1. Orange, green and pale magenta bars represent the van der Waals contributions and deep green, red and magenta bars represent electrostatic binding energies for 4c, 10a and 12b.
