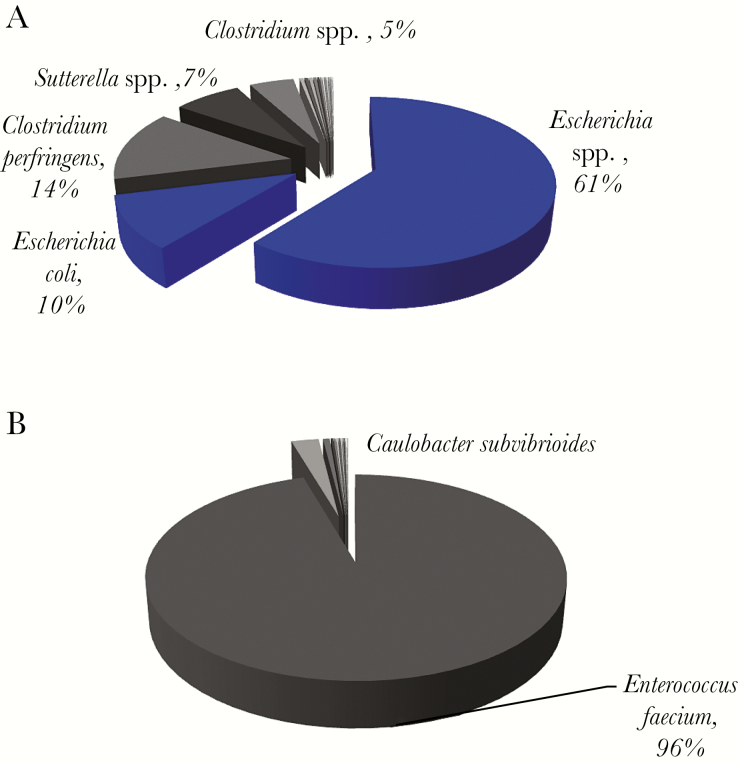
Figure 3.
Microbial composition and read abundance, determined by 16S rRNA sequencing in representative monomicrobial samples. (A) Gram stain of this sample showed 4+ polymorphonuclear leukocytes (PMNs) and 2+ Gram (+/-) rods, and Escherichia coli was isolated by culture. The dominant operational taxonomic units (OTUs) mapped to Escherichia spp. and E. coli. All organisms with ≥1% frequency were anaerobes or facultative anaerobes. (B) Gram stain of this sample was negative, but subculture of the specimen grew coagulase-negative Staphlococci. The dominant OTU was Enterococcus faecium. Blue pie slices denote concordance between 16S rRNA sequencing data and microbiologic cultures, and the pie slices in shades of gray indicate organisms with their read abundance not identified by culture.

