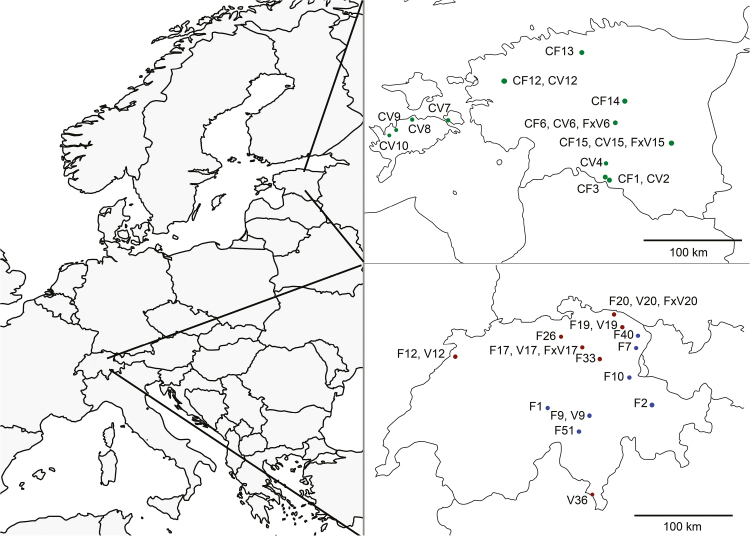
Figure 1.
Sampling sites in Switzerland and Estonia (top right). For Switzerland blue dots indicate Highland Switzerland populations, dark red dots Lowland Switzerland populations. Sites, where more than one taxon was co-occurring, are marked with one dot. Population codes can be found in Table 1.

