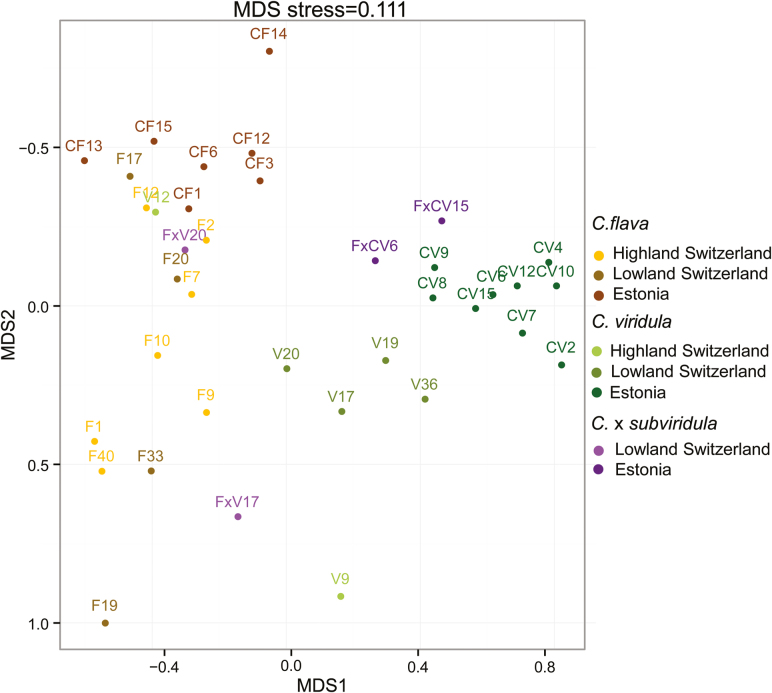
Figure 4.
Ordination according to a MDS analysis based on Reynold’s genetic distances between pairs of sampled populations, grouped by the three taxa C. flava (CF/F), C. viridula (CV/V) and C. × subviridula (FxV/FxCV) from the three regions Estonia (EST), Highland (CHH) and Lowland Switzerland (CHL). The stress value of 0.11 indicates a good quality of the graphical representation of the MDS analysis. For population codes see Table 1.

