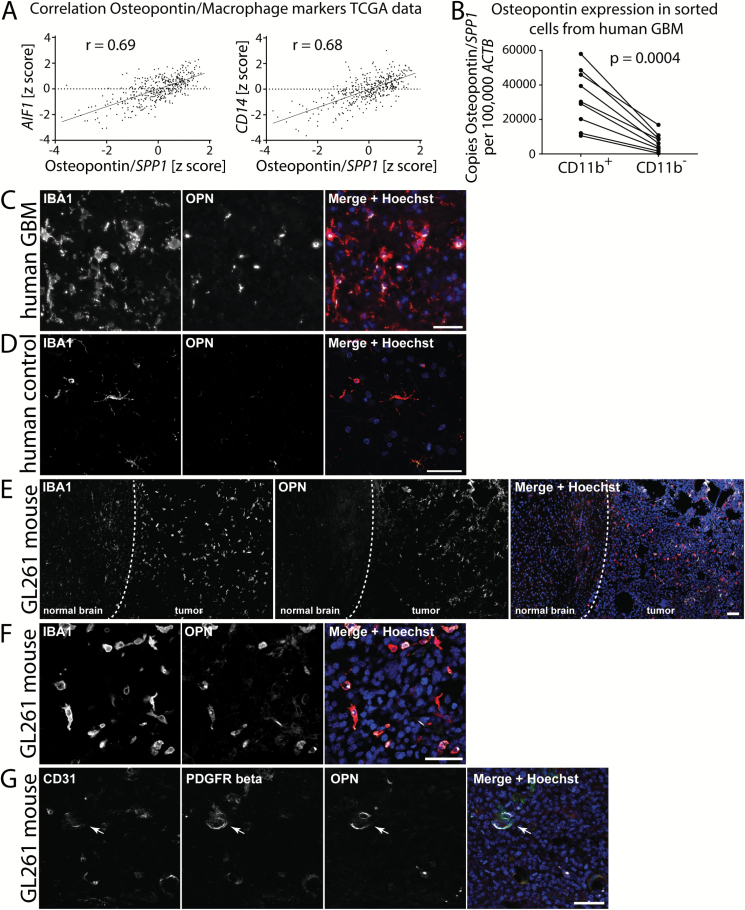
Fig. 1.
OPN expression in human and mouse glioblastoma. (A) TCGA gene expression data show that OPN expression in human GBM whole tumor samples strongly correlates with the expression of AIF1 (Iba1) and CD14. Pearson correlation was used to calculate correlation coefficients. (B) CD11b+ sorted cells from human GBM samples express higher levels of OPN than the CD11b− cell fraction from the same tumors. Analysis was done using Student’s t-test. (C) OPN staining in human GBM samples predominantly co-localizes with Iba1+ staining; 40x objective. (D) OPN is sparsely expressed in Iba1+ microglia in human autopsy control brain tissue. (E) OPN is strongly expressed in the tumor tissue of GL261 mouse glioblastoma. Dashed line represents the tumor border. (F) OPN staining in mouse GL261 tumors predominantly co-localizes with Iba1+ staining. (G) PDGFRβ+ pericytes lining CD31+ blood vessels also partially express OPN in GL261 glioblastoma (arrow). Bars represent 50 µm.

