Fig. 1.
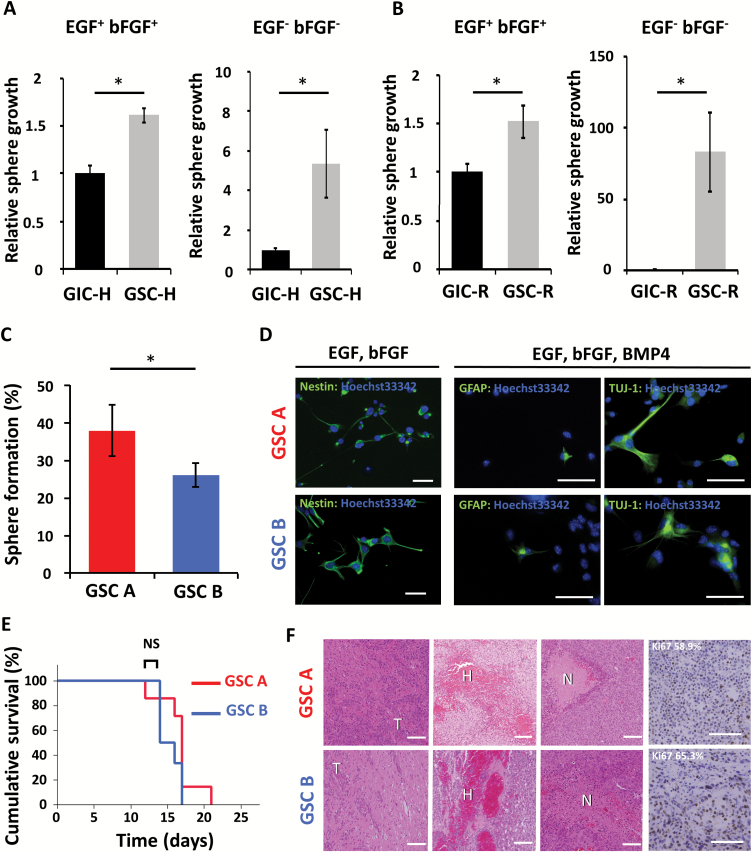
Stem cell characteristics of GSC A and B populations. (A) Relative sphere growth for GIC-H and GSC-H incubated for 7 days in medium conditioned to support neurosphere growth or in medium without growth factors. *P < 0.05. (B) Relative sphere growth for GIC-R and GSC-R incubated for 7 days in medium conditioned to support neurosphere growth or in medium without growth factors. *P < 0.05. (C) Percentage sphere formation from single GSC A or GSC B cells. *P < 0.05. (D) Immunofluorescence staining (green fluorescence) for markers of undifferentiated cells (nestin), astrocytes (GFAP), or neurons (βIII-tubulin, as detected by Tuj1 antibody) in GSC A and B cells cultured in the presence of the indicated growth factors. Nuclei were counterstained with Hoechst 33342 (blue fluorescence). Scale bars, 50 μm. (E) Kaplan–Meier analysis of overall survival for wild-type mice subjected to orthotopic implantation of GSC A (n = 7) or GSC B cells (n = 6) (1 × 10⁵). NS, not significant. (F) Hematoxylin-eosin staining and immunohistochemical staining of Ki67 of tumors formed by GSC A or B cells. The percentage of tumor cells positive for Ki67 is indicated. Scale bars, 100 μm. T, tumor; H, hemorrhage; N, necrosis.

