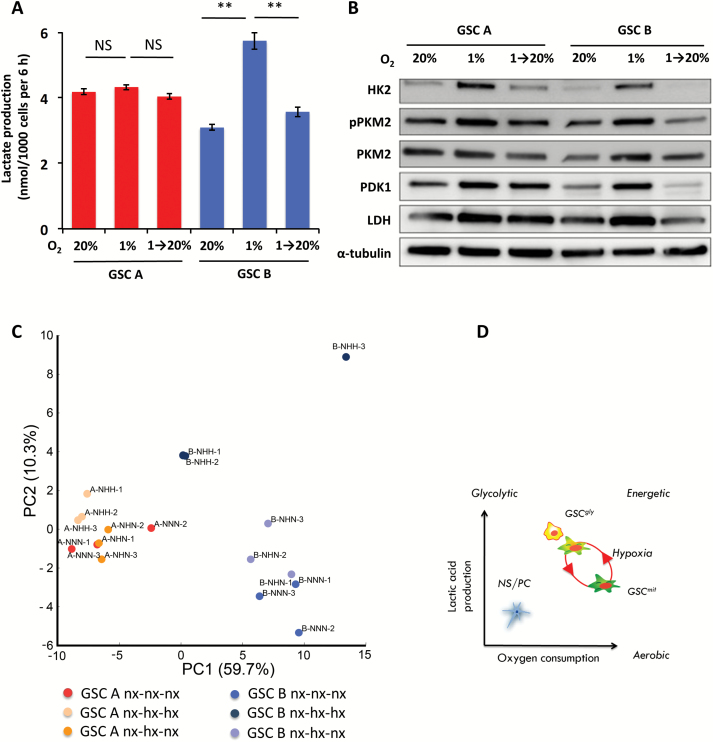
Fig. 6.
Reversible adaptation of GSC B cell metabolism to hypoxia. (A) Lactate production by GSC A or B cells cultured under either normoxic (20% O2) or hypoxic (1% O2) conditions for 8 days or exposed to hypoxia for 4 days followed by normoxia for 4 days. **P < 0.01. (B) Immunoblot analysis of glycolysis-related enzymes in GSC A and B cells cultured as in (A). (C) Score plot of the principal component analysis (PCA) of intracellular metabolites for cells cultured as in (A). Percentage values represent the contribution rate of the first (PC1) and the second (PC2) principal components. Nx: normoxia, hx: hypoxia. (D) Schematic representation of metabolic heterogeneity and plasticity in GSCs. GSCgly and GSCmit indicate GSCs with predominantly glycolytic or mitochondrial-type energy metabolism, respectively.

