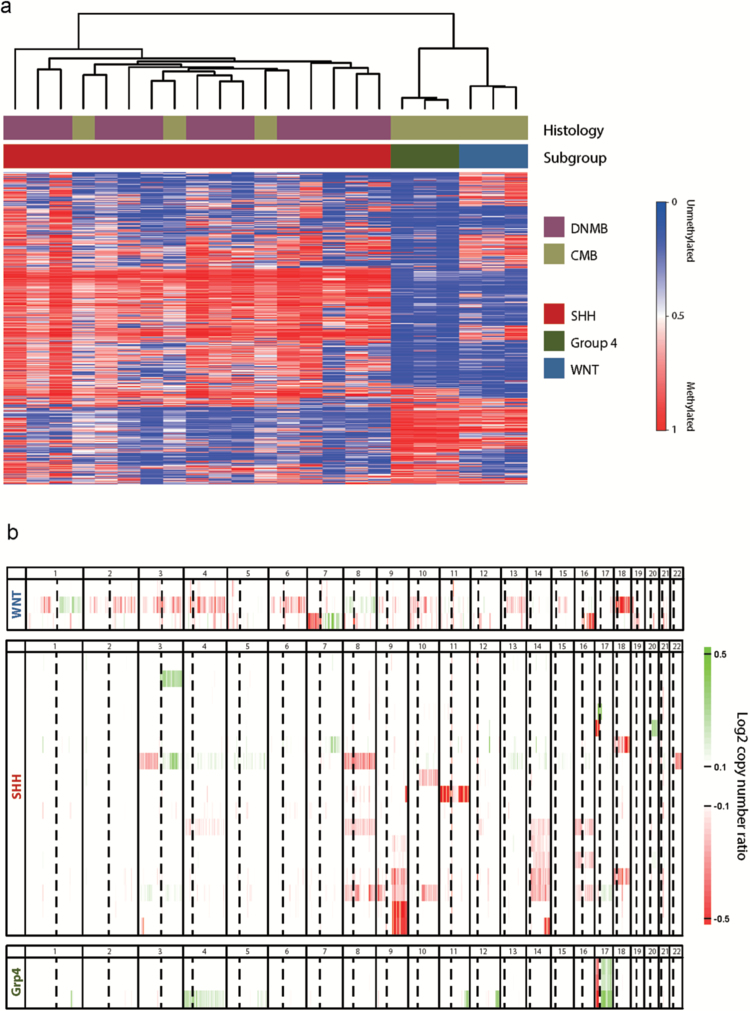
Fig. 1.
Histological and genetic distribution in NOA-07. (A) Clustering of samples based on the 5000 most differentially methylated cytosine-phosphate-guanine probes (standard deviation), with DNA methylation values shown from unmethylated (blue) to methylated (red). SHH-activated, WNT-activated, and non-WNT/non-SHH (Group 4) tumors are clearly distinct. DNMB, desmoplastic/nodular medulloblastoma; CMB classic medulloblastoma. (B) Summary of copy number profiles per molecular subgroup. Log2 copy number ratios (tumor: normal) are displayed on a scale from loss (red) to gain (green). Notable changes include monosomy 6 in one WNT-activated sample, loss of 9q in a subset of SHH-activated tumors, and iso(17q) in all 3 non-WNT/non-SHH (Group 4) tumors.

