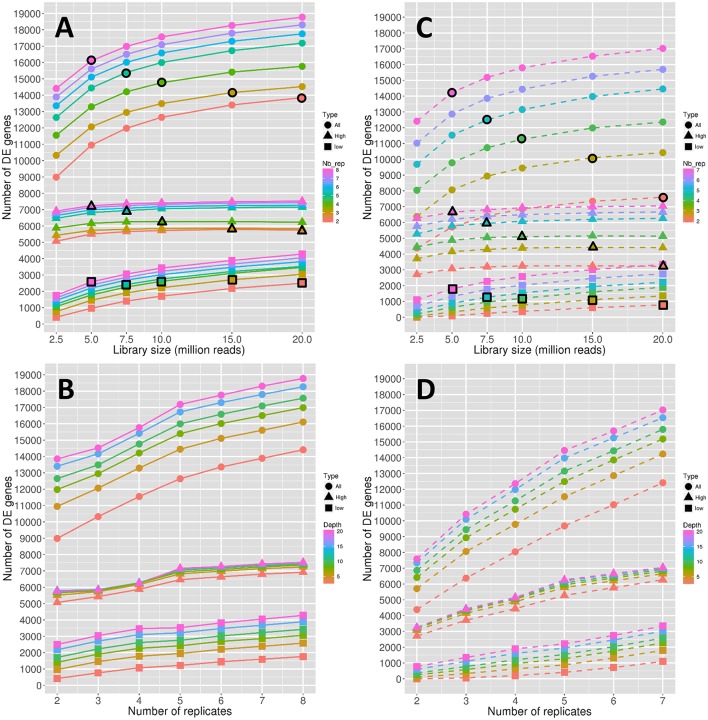
Figure 1.
Number of DE genes depending on the depth (A) and on the replicate number (B). Stability of the number of DE genes depending on the depth (C) and on the replicate number (D). Symbol colors correspond to the replicate numbers for (A,C) and to the library sizes for (B,D). Colored circles, triangles, and squares represent, respectively the values obtained with all genes, high expressed genes, and low expressed genes. Colored circles, triangles, and squares that are surrounded with a black line correspond to combinations of library sizes and replicate numbers with a total amount of 40 M reads approximately.

