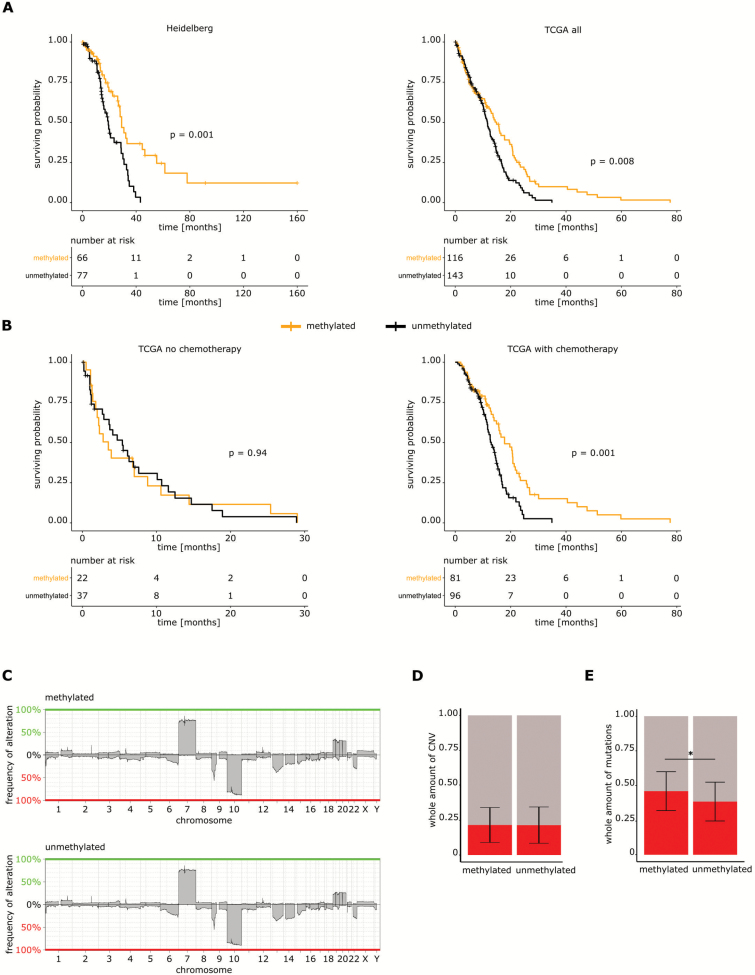
Fig. 1.
Copy number variations in primary glioblastoma according to MGMT promoter methylation. (A) Left panel: overall survival of 143 glioblastoma patients with IDH1 wildtype tumors according to MGMT promoter methylation. Right panel: survival analysis of patients with tumors from the dataset from TCGA regardless of the treatment. (B) Left panel: survival analysis of tumors of the TCGA glioblastoma database not receiving chemotherapy according to MGMT promoter methylation. Right panel: survival analysis of the dataset from TCGA treated with chemotherapy. (C) Graphical illustration of the percentage of CNV in the mMGMT and uMGMT groups. (D) Relative fractions of DNA copy number variations detected in the database from TCGA according to MGMT promoter methylation. Shown are the means ± standard deviation. (E) Average fraction of mutations detected in the dataset from TCGA according to MGMT promoter methylation. Shown are the means ± standard deviation.

