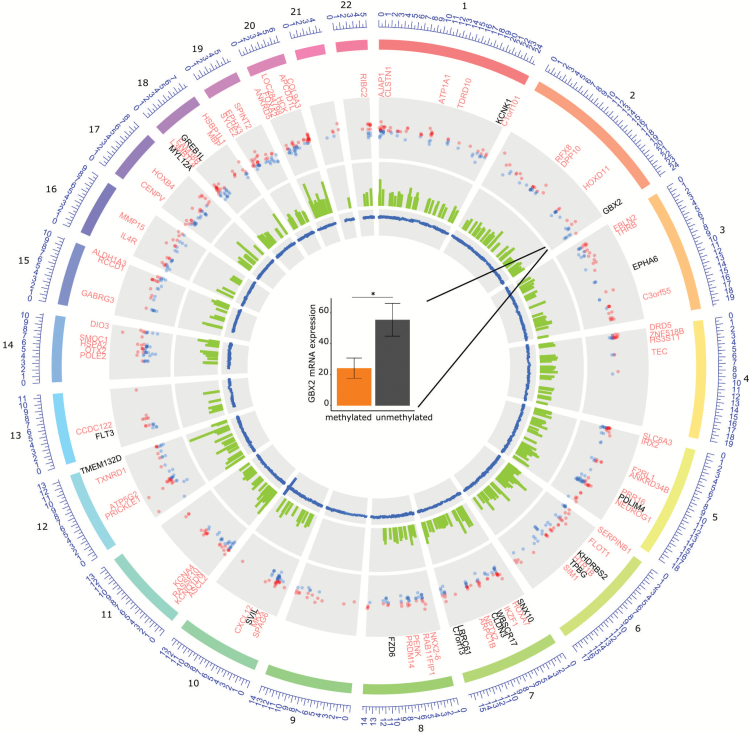
Fig. 2.
Differential methylation in primary glioblastoma according to MGMT promoter methylation. From outside to inside of the circle: First circle: hypermethylated genes in mMGMT tumors according to their chromosome position. Genes that were additionally downregulated in the RNAseq TCGA dataset are labeled in black, others in light red. Second circle: all DMPs within a promoter region of a gene. Third circle: area of each DMR between mMGMT and uMGMT glioblastomas. Fourth circle: all DMPs, including MGMT related on chromosome 10. Center: GBX2 mRNA expression in the dataset from TCGA in mMGMT and uMGMT glioblastomas.

