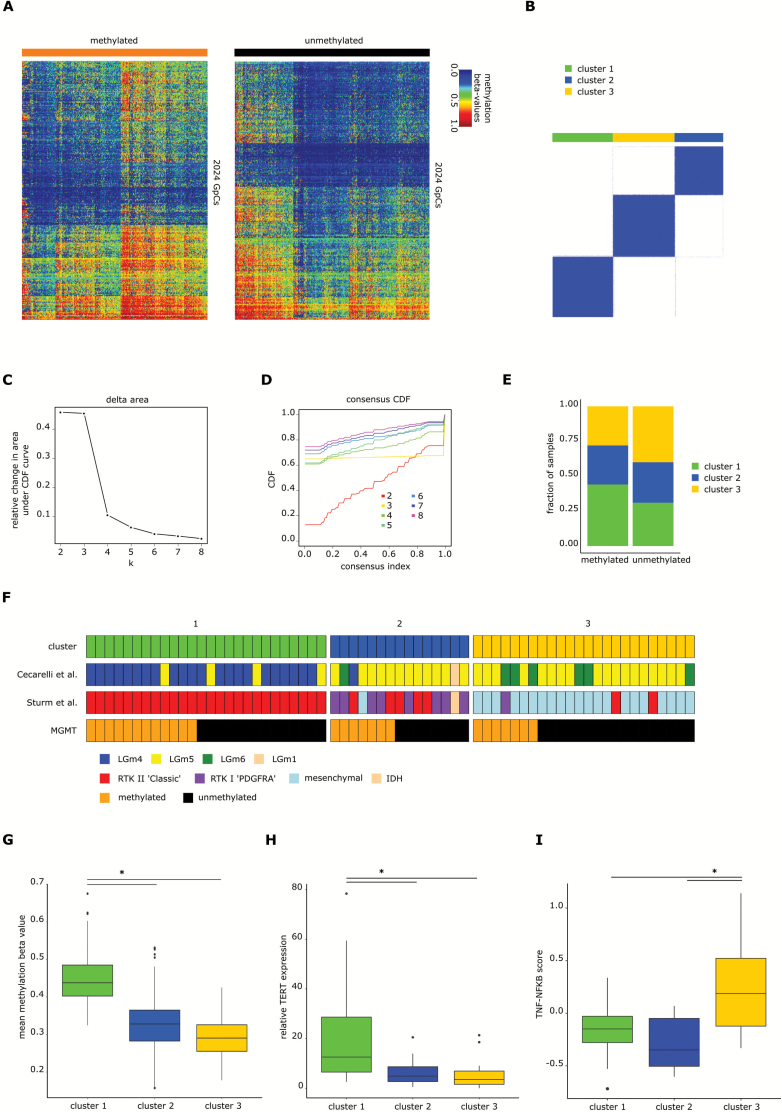
Fig. 3.
IDH wildtype glioblastoma cluster into 3 different clusters. (A) Heatmaps of 2024 positions that are differentially methylated between mMGMT and uMGMT tumors in the dataset of primary tumors, excluding MGMT related and intergenomic positions. (B) Consensus clustering using k-means of all samples of the primary tumor dataset. Shown is the result for k = 3. (C) Plot showing the relative change in area under the cumulative distribution function (CDF) curve in the k-means unsupervised clustering of primary glioblastoma. (D) CDF plot with examples from k = 2 to k = 8. Three clusters were chosen as the optimal number. (E) Distribution of mMGMT and uMGMT primary tumors into the clusters 1, 2, and 3. (F) Comparison of the cluster assignments with the clusters from Ceccarelli et al20 and Sturm et al21 for 65 glioblastoma samples of the database from TCGA. (G) Mean methylation beta-values of the 2024 differentially methylated CpGs, (H) relative TERT expression, and (I) TNF-NFκB score according to methylation clusters. The lower and the upper hinges correspond to the first and third quartiles. The upper and lower ends of the whiskers correspond to the 1.5× interquartile range from the hinge.

