Fig. 6.
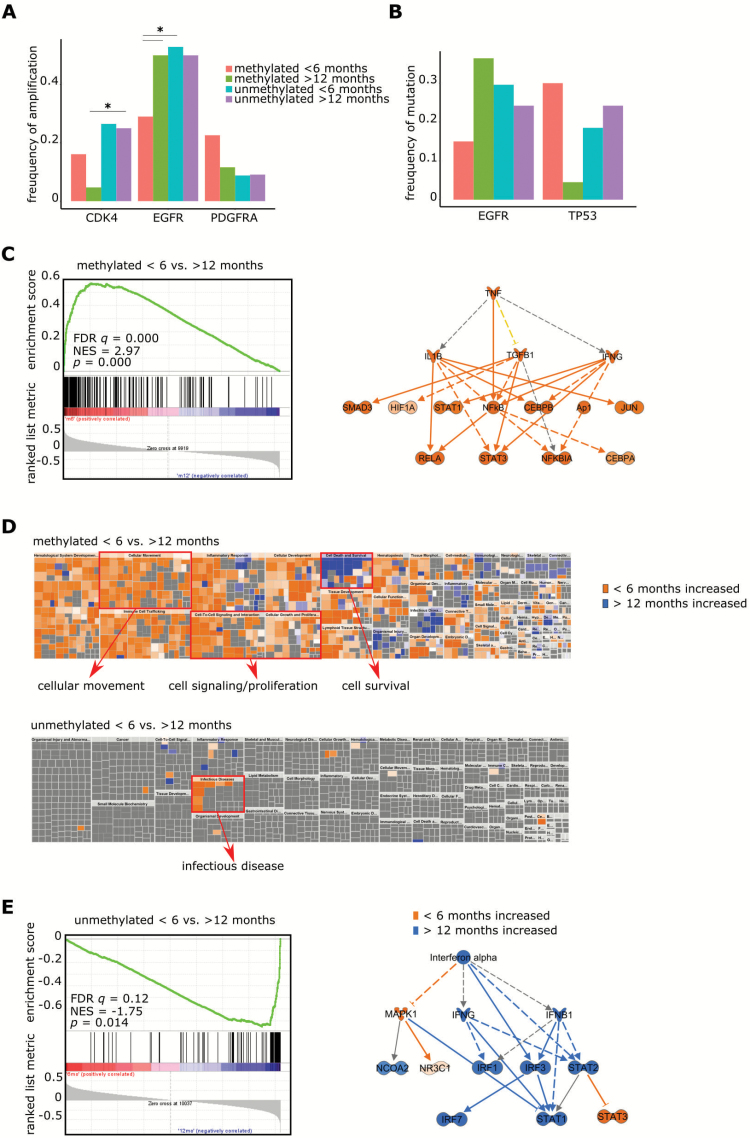
Comparison between glioblastomas of patients with different survival times (<6 mo vs >12 mo) according to MGMT promoter methylation status. (A) Copy number variations of CDK4, EGFR, and PDGFRA according to MGMT promoter methylation status and survival groups (<6 mo vs >12 mo) of glioblastoma patients in the cohort of TCGA. (B) Mutations of EGFR and TP53 according to MGMT promoter methylation status and survival groups of TCGA glioblastoma patients. (C) GSEA (left) and IPA (right) comparing results obtained for mMGMT tumors of patients with survival times <6 months vs >12 months. Prediction for upregulation is indicated in orange. (D) IPA of patients with survival times <6 months vs >12 months. Enriched differentially regulated functions are visualized and the topics cellular movement, cell survival, signaling, and proliferation as well as infectious disease are highlighted in red. (E) GSEA (left) and IPA (right) comparing results obtained for uMGMT tumors of patients with survival times <6 months vs >12 months. Prediction for upregulation is indicated in orange, for downregulation in blue.

