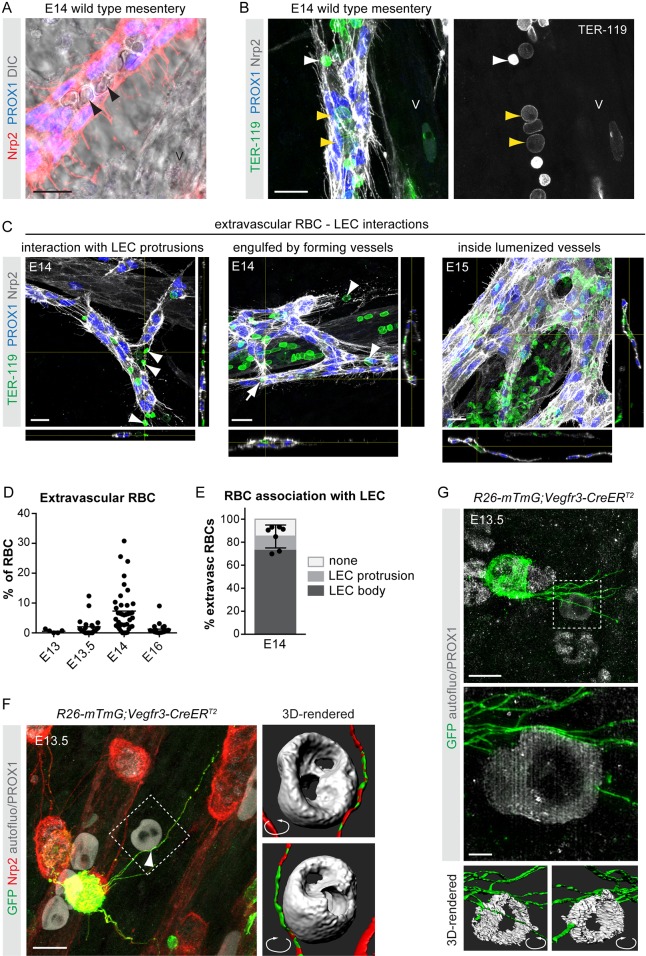
Fig. 1.
Transient RBC extravasation during the development of the mesenteric vasculature. (A,B) Whole-mount immunofluorescence (A,B) and DIC imaging (A) of E14 mesenteries showing RBCs inside lymphatic vessels (arrowheads). Both nucleated (TER-119low, yellow arrowheads in B) and enucleated (TER-119high, white arrowhead in B) RBCs were present. V, mesenteric vein. (C) Whole-mount immunofluorescence of mesenteric vessels for the indicated antibodies showing TER-119+ RBC interactions with Nrp2high LEC protrusions (E14; on the left), and engulfment by forming lymphatic vessels (E14; in the middle) and lumenized lymphatic vessels (E15; on the right). z-views at the indicated positions are shown below and on the right of each image. (D) The percentage of extravascular RBCs versus total (intravascular and extravascular) RBCs in the mesentery at the indicated stages of development. Dots represent individual embryos (E13: n=5) or vessels (E13.5: n=23; E14: n=39; E16: n=37) and horizontal lines represent mean values (see Materials and Methods for details). (E) The percentage of extravascular RBCs at E14 showing association with LEC protrusions (light gray), the LEC cell body (in most cases engulfment of RBCs by a cluster of LECs, and less frequently localization next to a cluster but associated with the cell body of an LEC; dark gray), or no association with LECs (white). Dots represent individual embryos (n=7), mean±s.d. (F) Deconvolved confocal image showing contact (arrowhead) between a protrusion from a mesenteric LEC (visualized by Nrp2 and PROX1 staining and GFP expression in a mosaically induced R26-mTmG;Vegfr3-CreERT2 embryo) and extravascular RBC (visualized by autofluorescence signal). Boxed area is shown on the right as a surface-rendered 3D image from angles that reveal association between RBC and LEC protrusion. (G) Reconstructed SIM images showing direct contacts between LEC (PROX1+GFP+) protrusions and a RBC (autofluorescence signal) in E13.5 R26-mTmG;Vegfr3-CreERT2 mesentery. Boxed area is shown below as a digital zoom-in of maximum intensity projection of central part of the image stack and as surface-rendered 3D reconstructions of whole image stack viewed from opposite angles illustrating how LEC protrusions align with the surface of the RBC. Scale bars: 20 μm (A-C); 10 μm (F,G, upper panel); 2 μm (G, lower panel).

