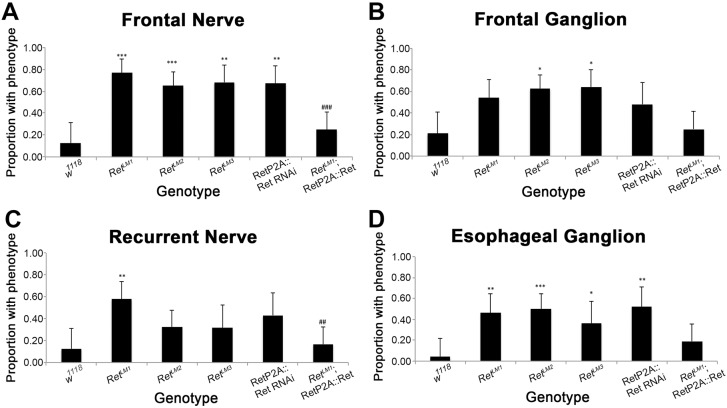
Fig. 3.
Quantification of embryonic SNS defects. (A) Absent or reduced frontal nerves were scored as phenotypes (see Fig. 2B). All mutants showed a statistically significant frequency of phenotypes. Expression of Ret rescued the phenotype, as the proportion of embryos with phenotypes was statistically different from RetLM1 mutants alone (###P=0.0001). (B) Frontal ganglion phenotypes were scored (asymmetric or misplaced cell bodies, see Fig. 2C) and tested for statistical significance. Rescue was not observed. (C) Recurrent nerve phenotypes were quantified (defasciculation, see Fig. 2D) and RetLM1 was rescued by Ret expression (##P=0.0011). (D) Esophageal ganglion (clumped or misplaced, see Fig. 2J) defects in the genotypes examined. Rescue was not observed. Error bars represent a 95% confidence interval and statistical significance relative to the w1118 control was assessed using Fisher's exact test with two tails and Bonferroni correction. Comparison of RetΔ1 and rescue of the mutation were assessed independently with the same test (#). For each panel, n=24, 26, 40, 22, 21, 36 in the order of the columns from left to right. *P<0.05, **P<0.01, ***P<0.001.

