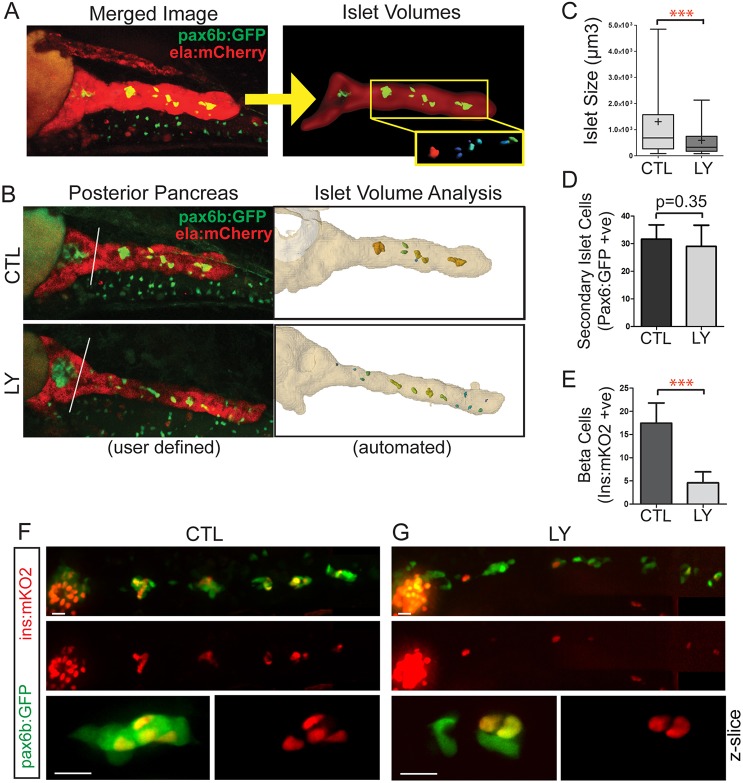
Fig. 6.
PI3K inhibition interferes with islet assembly assay. (A) Secondary islet analysis is based on the identification and three-dimensional segmentation of exocrine pancreas as labeled by ela:mCherry expression. (B) With our automated script, the user defines the posterior pancreas based on a composite image of the middle slice of ela:mCherry (red channel) and a z-projection of the pax6b:GFP image stack (left, white line). The custom software automatically delineates the whole pancreas and secondary islets (right). (C) Quantitation of secondary islet size of the samples analyzed in Fig. S10B-D, using the automated method. In box-whisker plots, box extends from the 25th to 75th percentile, whiskers indicate 5th and 95th percentile, line at median, ‘+’ indicates mean. ***P<0.001, Mann–Whitney test (one-tailed). CTL, n=10 larvae, 133 objects, LY, n=8 larvae, 80 objects. (D) pax6b:GFP+ cells in the posterior pancreas of embryos treated as in C. Mean±s.d. CTL, n=13; LY, n=9. Unpaired t-test. (E) ins:mKO2+ cells at 8 dpf in samples treated as in C. CTL, n=16; LY, n=14. Mean±s.d. Unpaired t-test, ***P<0.0001. (F,G) Representative images of 8 dpf pax6b:GFP;ins:mKO2 larvae. Control (F) or treated from 6 dpf to 8 dpf with 15 μM Ly294002 (G). Overview images (F,G, top and middle) were assembled by stitching together images of partially overlapping regions using the Pairwise Stitching plug-in for ImageJ (Preibisch et al., 2009). Scale bars: 50 µm. (F,G, bottom) Single slices from z-stacks of higher magnification images. Scale bars: 10 µm.

