Fig. 3.
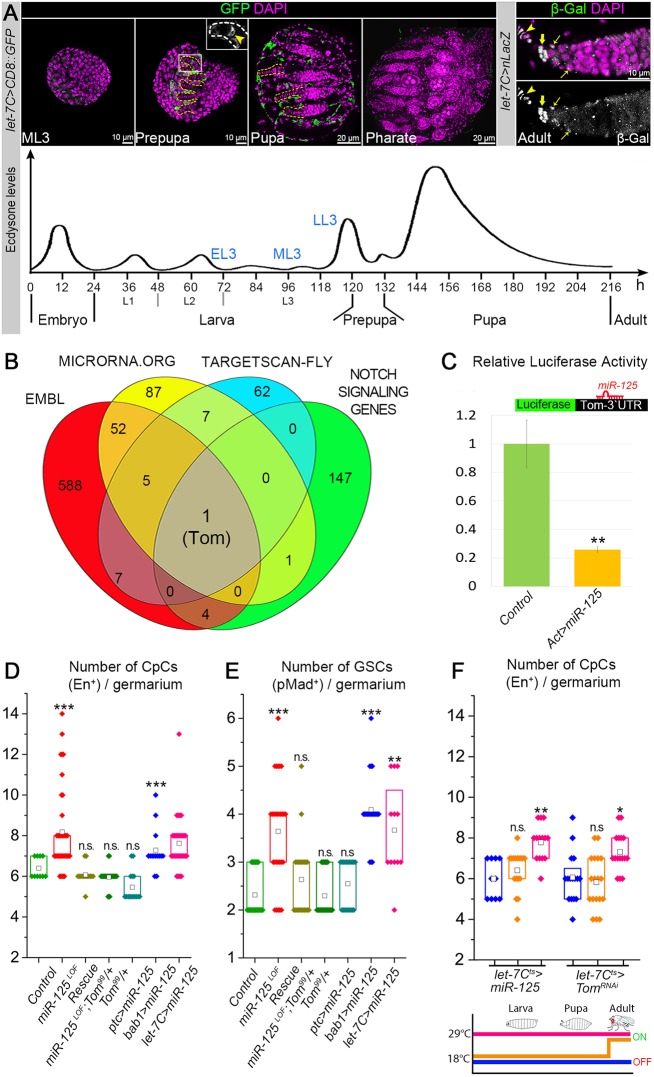
miR-125 regulates Notch signaling via targeting Tom. (A) let-7C expression (green) at different stages of ovary development. Expression of let-7C is detected in solitary TFCs (yellow arrowhead) and SHCs (prepupa-pupa); let-7C expression is absent in the pharate ovaries and, later, it can be detected again in the adult germarium in the TFCs and CpCs (high levels), and ECs (low levels). TFs are outlined by dashed lines; thick yellow arrows point to the adult niche cells (CpCs), thin yellow arrows point to ECs. Induction of let-7C coincides with the ecdysone pulse at LL3-prepupa stage. (B) Venn diagrams of putative let-7, miR-100 and miR-125 miRNAs targets from different miRNA target prediction databases (EMBL, microrna.org and TARGETSCAN-Fly) and annotated gene ontology terms for the Notch signaling pathway components (FlyBase). Overlap identifies a single target: Tom. (C) Expression of miR-125 in S2 cells leads to the downregulation of the Tom-3′UTR luciferase reporter. Bar graph represents relative downregulation. Data are mean±s.d. (see also Table S1). (D-F) Box plots represent the number of CpCs, marked by En (D,F), and number of GSCs, marked by pMad, in the adult germaria (E). Loss of miR-125 (miR-125LOF) leads to the increased numbers of CpCs and GSCs, whereas reduction of Tom levels by one copy in miR-125 mutants (rescue) restores the normal numbers of CpCs and GSCs. Upregulation of miR-125 with bab1-Gal4 and let-7C-Gal4, but not with ptc-Gal4, drivers increases the CpC and GSC numbers. For Gal4 driver expression patterns, refer to Fig. S1B-D. (F) miR-125 upregulation or Tom downregulation with let-7C-Gal4 increases the CpC numbers only when expressed during pre-adult stages but not during adulthood. Colors in the schematics of the gene switch system used for the activation of transgenes corresponds to box plot colors. The box plots (D-F) represent the interquartile range (IQR) or 25th and 75th percentiles of the data set. The mean value (square) is displayed inside the box. One-way ANOVA with post-hoc Tukey HSD was used to test for statistical significance in D-F. All samples were compared with the controls under the same conditions: ***P≤0.001; **P≤0.01; n.s., P≥0.05.

