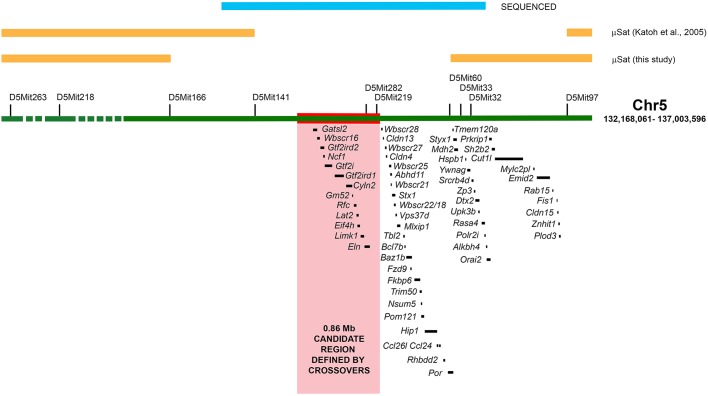
Fig. 7.
Genetic mapping of the pma mutation. The region of chromosome 5 linked to the pma mutation by Katoh et al. (2003) is represented by the green horizontal bar, with the location of all genes listed below. Positions of microsatellites (μSat) used for genetic mapping are shown by black bars. The region eliminated from the candidate area by this study is shown by orange bars (see Table 1), with additional orange bars showing the minimum area defined by Katoh et al. (2003). The 3.04 Mb region sequenced in crossover animals, PMA and BALB/c founders is indicated by the blue bar. The red bar and pink shaded area represent the region within the crossovers identified by sequencing, and delineate a 0.86 Mb region most likely to encompass the pma mutation, containing 13 genes.

