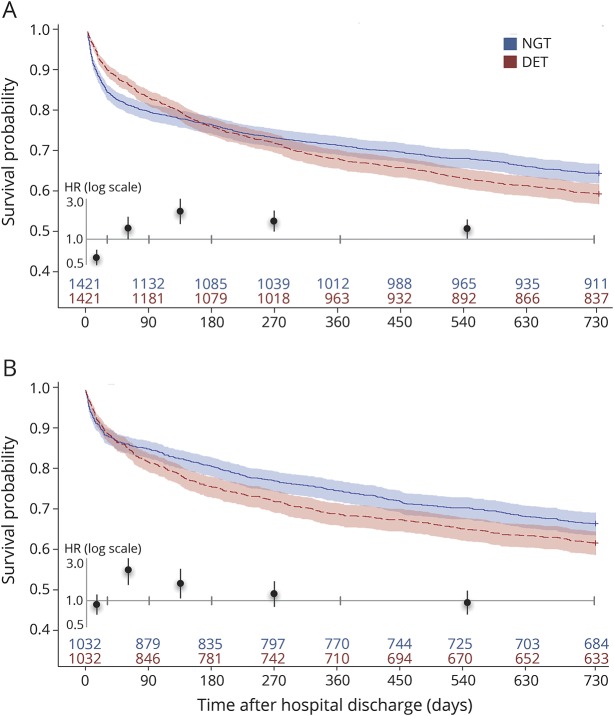
Figure 1. Survival probability from acute discharge in patients who received direct enteral tubes versus nasogastric tubes alone.
Survival probability with 95% confidence intervals calculated from Cox proportional hazard models in patients with direct enteral tubes (DET; red) versus nasogastric tubes alone (NGT; blue), from discharge date, with propensity matching on (A) baseline variables, and (B) baseline variables plus length of stay and modified Rankin Scale score. Number of patients alive is shown for all time points. Mortality hazard ratios (HR) for DET vs. NGT are shown for all 5 epochs (inset, tic marks showing intervals; see table 2 and table e-8 for values).

