Fig. 4.
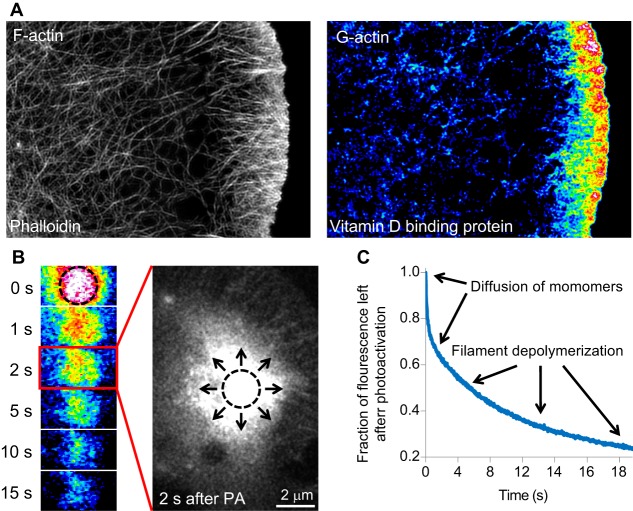
Methods for visualizing G-actin. (A) Actin monomers can be visualized in fixed cells with monomer-specific probes such as vitamin D-binding protein. Here, structured illumination super-resolution images show the same cell stained with both phalloidin, to visualize F-actin, and vitamin D-binding protein, to visualize actin monomers. The vitamin D-binding protein image is pseudocolored to emphasize changes in fluorescence, with warmer colors representing increased fluorescence. Actin monomers can be seen localized to the leading edge. (B) G-actin can be visualized in live cells by measuring rapid changes in fluorescently labeled actin. Here, a pulse-chase experiment is performed using actin labeled with photoactivatable GFP. After photoactivation (PA, occurring in the region marked by the dotted circle), the actin is highlighted and can be followed over time. The G-actin rapidly diffuses away from the PA region in seconds (represented by the arrows in the magnified image), which is emphasized by the middle panel showing a larger image of the cell two seconds after actin was photoactivated. (C) A representative graph from this type of experiment shown in B, highlighting which parts of the fluorescence decay curve are due to diffusion of monomers away from the photoactivated region and which parts arise from the disassembly of F-actin that occurs on a slower time scale. Images in A are similar to those published in Lee et al., 2013; images in B are similar to those published in Kapustina et al., 2016.

