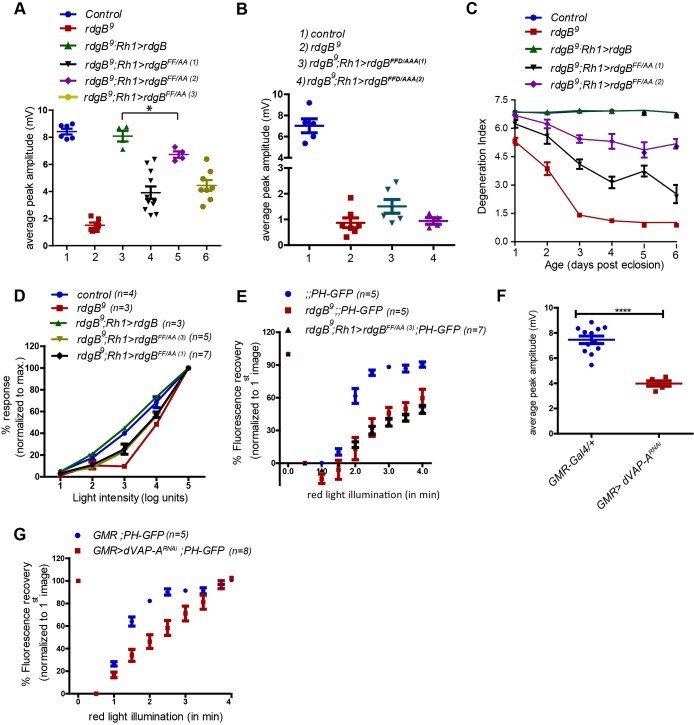
Fig. 4.
FFAT–dVAP-A interaction is essential for normal RDGBα function in vivo. (A,B) Quantification of average ERG response of flies of indicated genotypes. Each data point represents a single fly tested. Error bars represent s.e.m. P-values were calculated using Student's t-test. (C) Comparison of retinal degeneration in flies exposed to 12 h:12 h light-dark regime (light intensity: 1100 lux). Degeneration index represents average number of intact rhabdomeres present per ommatidium. (D) Intensity response functions of 1-day-old flies of indicated genotypes. Average ERG response is depicted over a range of light intensities separated by 1 log unit each. Average ERG response at any given intensity of light is shown as a percentage of the response recorded at maximum light intensity. (E) Recovery kinetics of fluorescent pseudo pupil with time. (F) Quantification of average ERG response. Each data point represents a single fly tested. Error bars represent s.e.m. P-values were calculated using Student's t-test. (G) Recovery kinetics of fluorescent pseudo pupil with time. P-values were calculated using two way ANOVA with Bonferroni post-test corrections. Data points in A-G represent mean±s.e.m. *P<0.05, ****P<0.0001.

