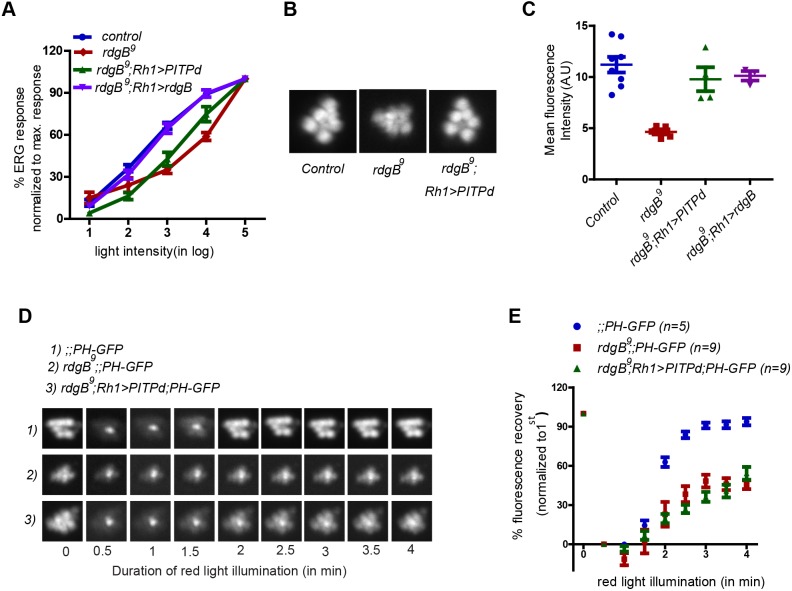
Fig. 5.
PITPd fails to rescue rdgB9 phenotypes during strong PLC stimulation. (A) Intensity response functions of 1-day-old flies of indicated genotypes. Average ERG response is depicted over a range of light intensities separated by 1 log unit each. Average ERG response at any given intensity of light is shown as a percentage of the response recorded at maximum light intensity. Each data point represents mean±s.e.m. N=5 for each genotype. (B) Representative pseudo pupil image of flies captured after 6 min of dark adaptation. (C) Quantification of mean intensity associated with the pseudo pupil. (D) Representative fluorescent pseudo pupil images acquired at different time points during pseudo pupil imaging of indicated genotypes. (E) Recovery kinetics of fluorescent pseudo pupil over time. Average fluorescence intensity of each pseudo pupil image is expressed as a percentage of the intensity of first image acquired. Each data point represents mean±s.e.m.

