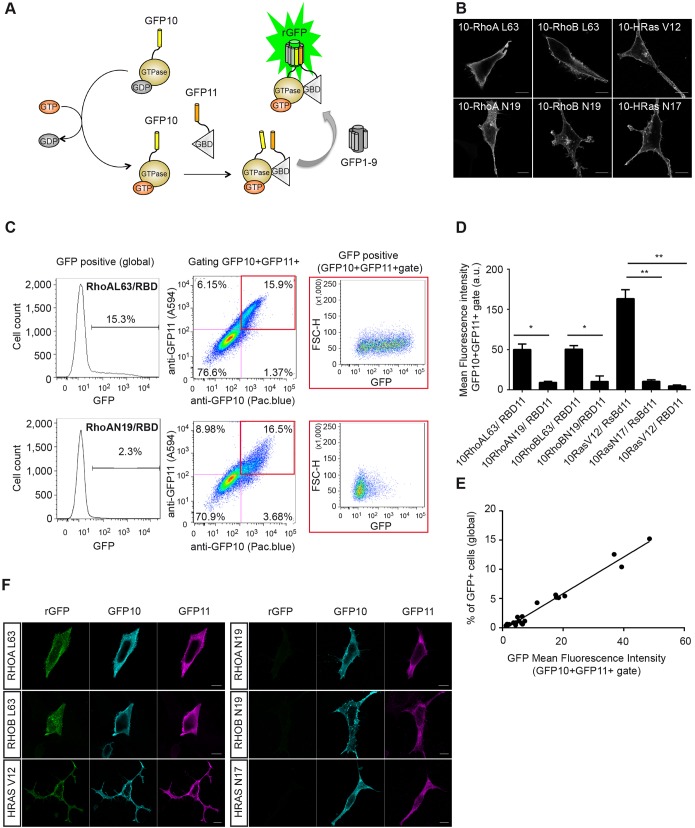
Fig. 1.
Characterization of a split-GFP reporter of small-GTPase activation. (A) Design of the reporter system. The GTPase is fused to the C-terminus of GFP10 and the cognate binding domain of the GTPase effector (GBD) to the N-terminus of GFP11. When the GTPase is activated (GTP-bound), interaction with the effector domain occurs, enabling complementation with GFP1-9 and formation of reconstituted full-length GFP (rGFP). (B) Localization of the indicated GFP10–Rho and GFP10–Ras mutants in HEK_GFP1-9 cells (anti-GFP10 immunostaining). L63 and V12 mutants are constitutively active; N19 and N17 mutants are dominant negative. Scale bars: 10 µm. (C) FACS analysis of active GFP10–RhoA (L63) and inactive GFP10–RhoA (N17) mutants with the GFP11-tagged Rho-binding domain of Rhotekin (RBD-11). Representative dot plots show the gating strategy to quantify GFP fluorescence from the global population and from the cell population positive for GFP10 and GFP11 immunostaining (GFP10+ GFP11+). The histograms on the left show the percentage of GFP-positive cells relative to untransfected cells in the global population. See also Fig. S2. (D) Quantification of split-GFP fluorescence in the GFP10+GFP11+ region from HEK_GFP1-9 cells co-transfected with the indicated GFP10–Rho and GFP10–HRas variants and the respective GTPase binding domain of their effector. RsBD-11, H-Ras-binding domain of c-Raf1. Results are mean±s.e.m.; n=3 independent experiments. *P<0.05, **P<0.01 (paired Student's t-test). (E) Correlation between the percentage of GFP fluorescent cells in the global population and the mean GFP fluorescence intensity of GFP10 and GFP11 co-expressing cells for the set of GTPase–effector interactions tested above. (F) Representative confocal microscopy images of Rho–RBD and Ras–RsBD interactions leading to fluorescence of rGFP, as well as immunofluorescence from anti-GFP10 (cyan, GTPase) and anti-GFP11 (magenta, GBD) antibody staining. Scale bar: 10 µm.

