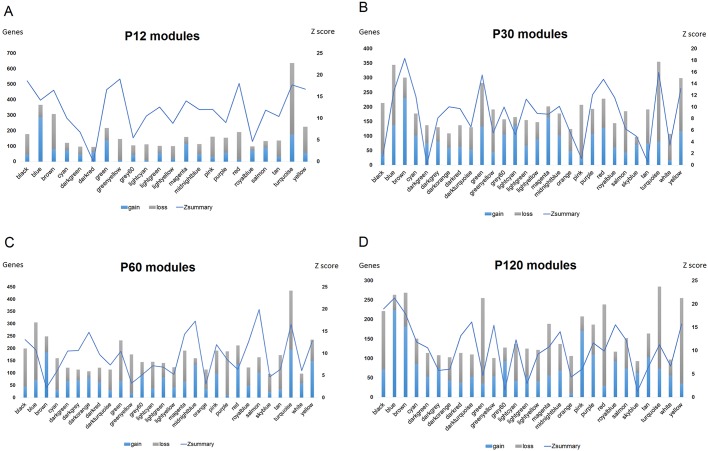
Fig. 1.
Analyses of module preservation and intramodular connectivity changes between HS and CTRL networks. Genes were ranked according to their intramodular connectivity, and changes in ranking positions were determined between networks for identifying nodes and modules associated with gain or loss of connectivity. The summary statistic Zsummary is used to assess preservation of module density and connectivity between the networks. Zsummary<2 denotes no preservation, 2<Zsummary<10 indicates weak to moderate evidence of preservation, and Zsummary>10 suggests strong module preservation.

