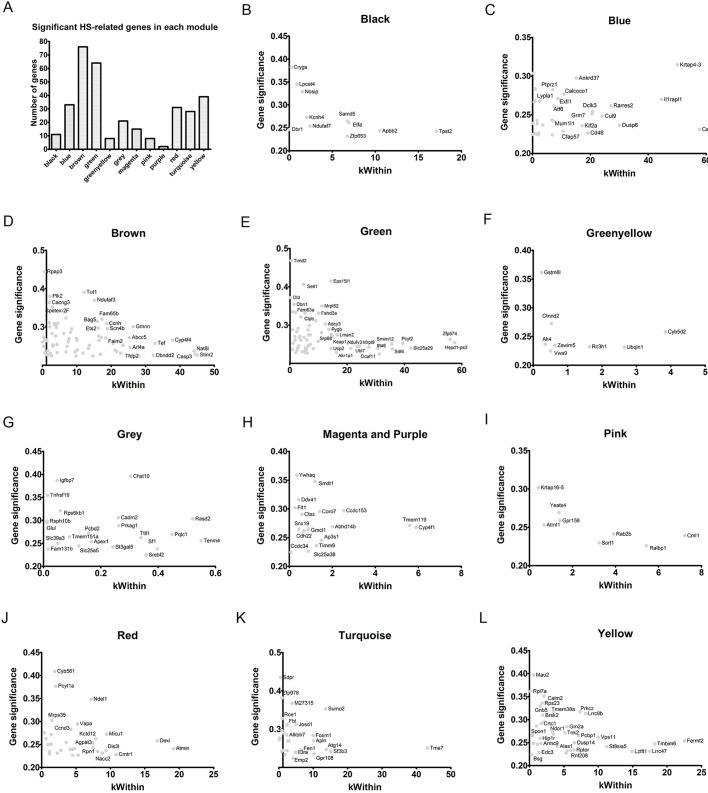
Fig. 3.
Significant genes correlated with the HS group in each module, based on the analysis depicted in Fig. 2. Specific genes in each module were significantly associated with the HS group. (A) The number of genes in each module that displayed a P-value for gene significance (GS) <0.1. (B-L) Scatter plots constructed using the Kwithin (x-axis) and GS (y-axis) values for each gene in their corresponding modules.

