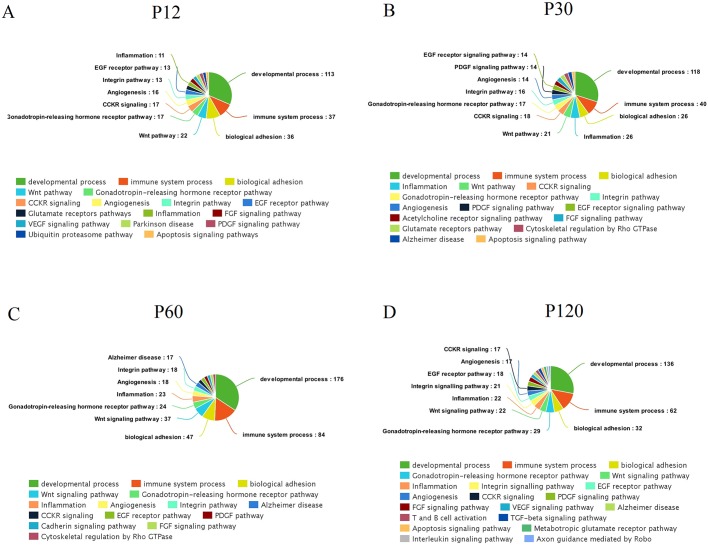
Fig. 4.
Pie charts showing the percentage of genes for selected enriched biological functions and pathways at different time points after hyperthermic seizures. (A-D) The functions identified in the modules that gain connectivity in the HS networks. Networks were constructed using the HS and CTRL samples separately, to allow comparison between HS and CTRL networks at each time point.

