Fig. 1.
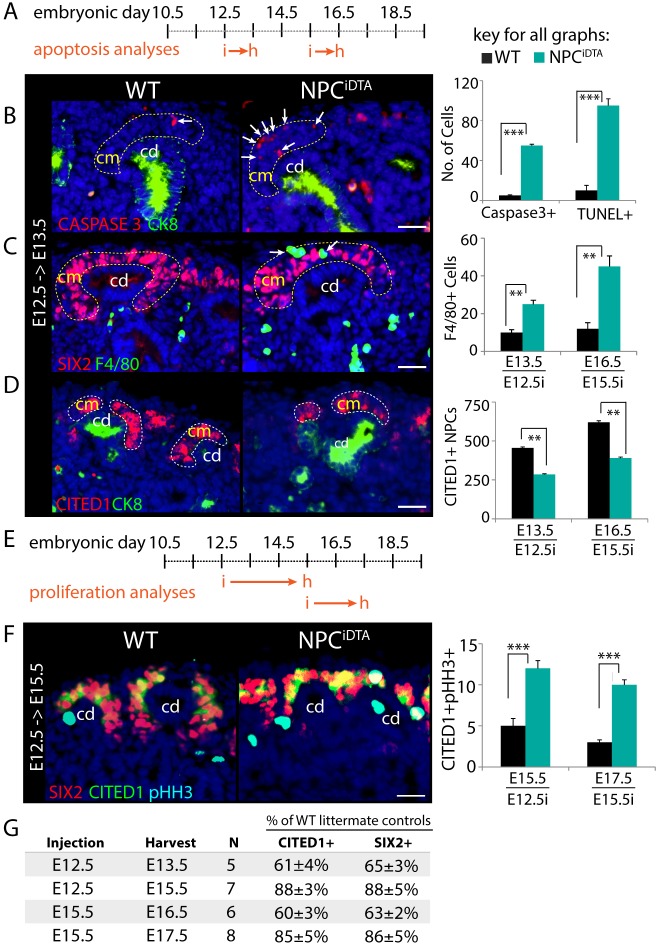
Transient ablation of CITED1+ NPCs triggers a compensatory increase in proliferation in surviving cells. (A) Schematic shows the stages at which tamoxifen was injected (i) and kidneys were harvested (h) for apoptosis analyses in WT (R26RDTAhet) and NPCiDTA (Cited1-creERT2;R26RDTAhet) mice. (B) Caspase3 (red, apoptosis) and cytokeratin 8 (CK8, green, collecting duct) immunostaining in kidneys injected at E12.5. White arrows point to Caspase3+, and F4/80+ cells in the CM (highlighted by dashed lines). Graph shows number of caspase3+ (E13.5) and TUNEL+ (E16.5) cells scored per cap mesenchyme (CM) per kidney section. (C) F4/80 (green, macrophages) and SIX2 (red, CM) staining. Number of F4/80+ cells per CM per kidney section is shown in the graph. (D) CITED1 (red, NPC marker) and CK8 (green, collecting duct) staining. Graph represents the number of CITED1+ NPCs estimated per kidney section. (E) Schematic shows the stages at which tamoxifen was injected (i) and kidneys were harvested (h) for proliferation analyses in WT and NPCiDTA mice. (F) CITED1 (green), SIX2 (red) and pHH3 (cyan blue, proliferation marker) staining. Graphs show quantitation of CITED1+pHH3+ cells per kidney section. (G) Table shows the percentage of CITED1+ and SIX2+ cells remaining after 24 (E12.5→E13.5, E15.5→E16.5), 48 (E15.5→E17.5) and 72 (E12.5→E15.5) hours in NPCiDTA kidneys relative to WT littermates. N indicates the number of mice analyzed at each time point. Data represent means±s.e.m. **P<0.005 and ***P<0.005, 2-tailed Student's t-test. Scale bars: 100 μm. cd, collecting duct; cm, cap mesenchyme. See also Fig. S1.

