Fig. 5.
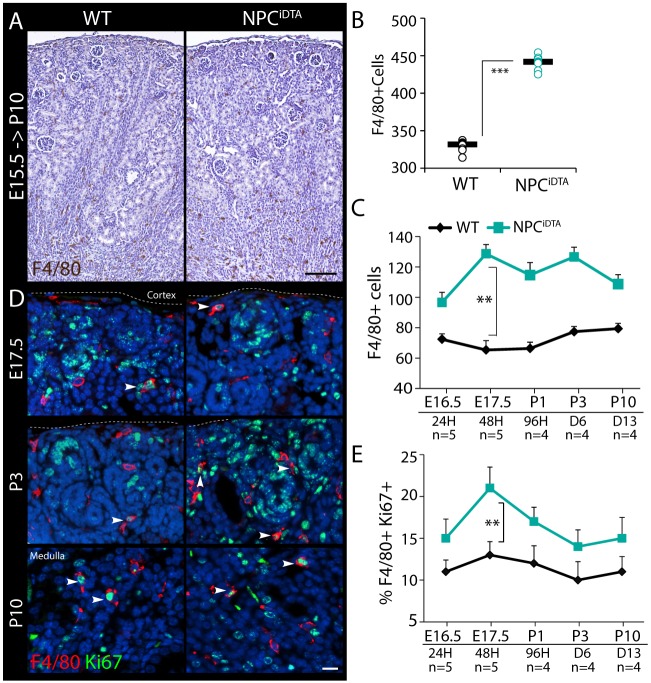
Increased retention of F4/80+ macrophages in NPCiDTA kidneys. (A,B) F4/80 (macrophages) staining. Number of F4/80+ cells was scored per kidney section. (C) Number of F4/80+ cells scored at various time points after tamoxifen treatment at E15.5. Cell numbers were normalized to organ size at each time point. (D,E) F4/80 (red) and Ki67 (green; proliferation marker) co-staining. Percentage of F4/80+Ki67+ cells (white arrowheads) per kidney section is shown. n, number of individual tamoxifen-treated mice analyzed per group. Data represent means± s.e.m. **P<0.005 and ***P<0.0005, 2-tailed Student's t-test. Scale bars: 200 μm (A), 50 μm (D). See also Fig. S3.

