Fig. 6.
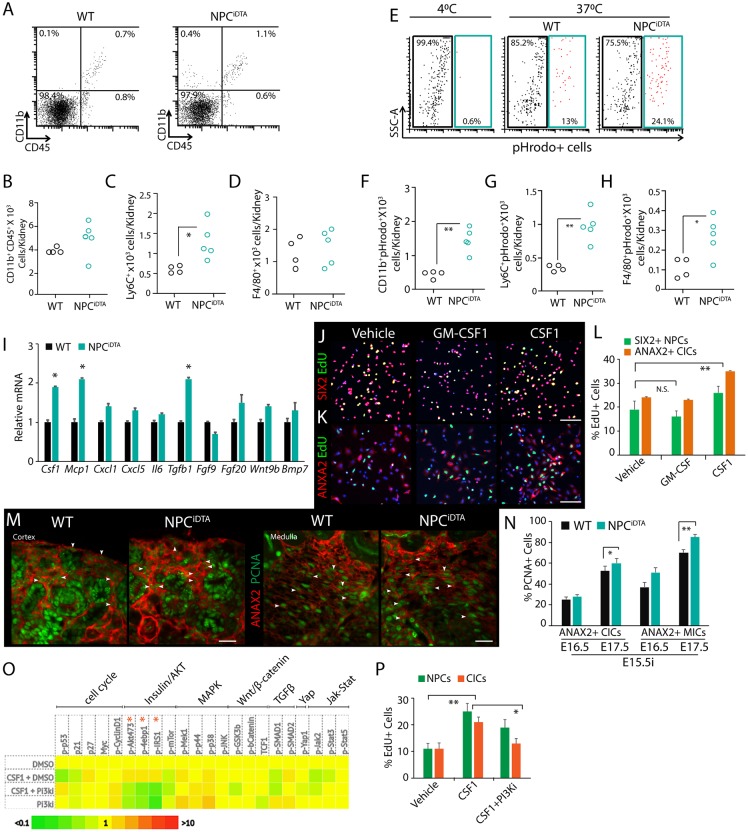
Functional analysis of macrophages in NPCiDTA kidneys. (A-D) Representative dot plots show the percentage of CD11b+ and CD45+ cells in 24 h tamoxifen-treated WT (n=4) and NPCiDTA (n=5) kidneys injected at E15.5. The total cell number was calculated from viable cell counts and expressed as the number of cells per kidney. Numbers of CD11b+CD45+, Ly6C+ and F4/80+ cells were calculated from the corresponding percentage of each cell subpopulation, and total number of cells. (E-H) Dot plot shows percentage of active phagocytes (pHrodo+; blue gate) within the CD11b+CD45+Ly6G− cell population. Data represent means±s.e.m. from 4 experiments. *P<0.05 and **P<0.005, unpaired Student's t-test. (I) Transcriptional analysis of chemokines and growth factors in 24 h tamoxifen-treated WT and NPCiDTA kidneys injected at E15.5. Three biological replicates (n=3) analyzed per group. (J-L) Proliferation analysis with EdU labeling (green; proliferation marker) of purified E17.5 NPCs (SIX2; red) and CICs (ANAX2; red) treated with vehicle, CSF1 and GM-CSF for 24 h. Graph shows percentage of EdU+SIX2+ NPCs and EdU+ANAX2+ CICs in each condition. Data represent means±s.e.m. from 3 experiments. (M,N) ANAX2 (red; interstitial cells) and PCNA (green; proliferation marker) co-staining. Quantitation of the number of ANAX2+ PCNA+ cells (white arrowheads) in the cortical nephrogenic zone and medullary interstitium. (O) Heat map shows expression profile of various signaling pathway components in NPCs treated with vehicle (DMSO), CSF1 and PI3K inhibitors (PI3Ki). Two biological replicates analyzed per condition. (P) Graph shows percentage of EdU+ NPCs and CICs treated with vehicle (DMSO), CSF1 and PI3Ki. Data represent means±s.e.m. from 2 experiments. *P<0.05 and **P<0.005, 2-tailed Student's t-test. Scale bars: 200 μm (J), 50 μm (M). See also Fig. S5.

