Fig. 7.
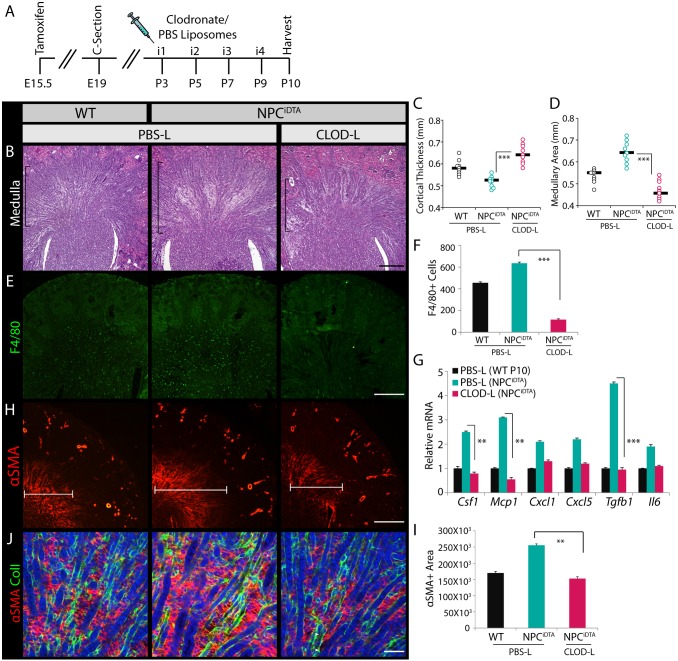
Postnatal ablation of macrophages resolves interstitial expansion in P10 NPCiDTA kidneys. (A) Schematic illustrates the timeline of PBS (PBS-L) and clodronate liposome (CLOD-L) administration in WT and NPCiDTA mice. (B-D) H&E-stained sections show the medullary region (bracketed area) of PBS-L- and CLOD-L-treated P10 WT and NPCiDTA kidneys. Cortical thickness (C) and medullary area (D) were measured per kidney section. Number of mice analyzed per group (n)=4. (E,F) F4/80 (green) staining. Graph shows the number of F4/80+ cells per kidney section. (G) Transcriptional analysis of chemokines in P10 WT and NPCiDTA kidneys. (H,I) αSMA (red) staining and quantitation of αSMA+ medullary area (µm2) per kidney section. (J) Co-staining of αSMA (red) with collagen I (green). Data represent means±s.e.m. **P<0.005 and ***P<0.0005, 2-tailed Student's t-test. Scale bars: 200 μm (B,E,H), 100 μm (J). See also Fig. S6.

