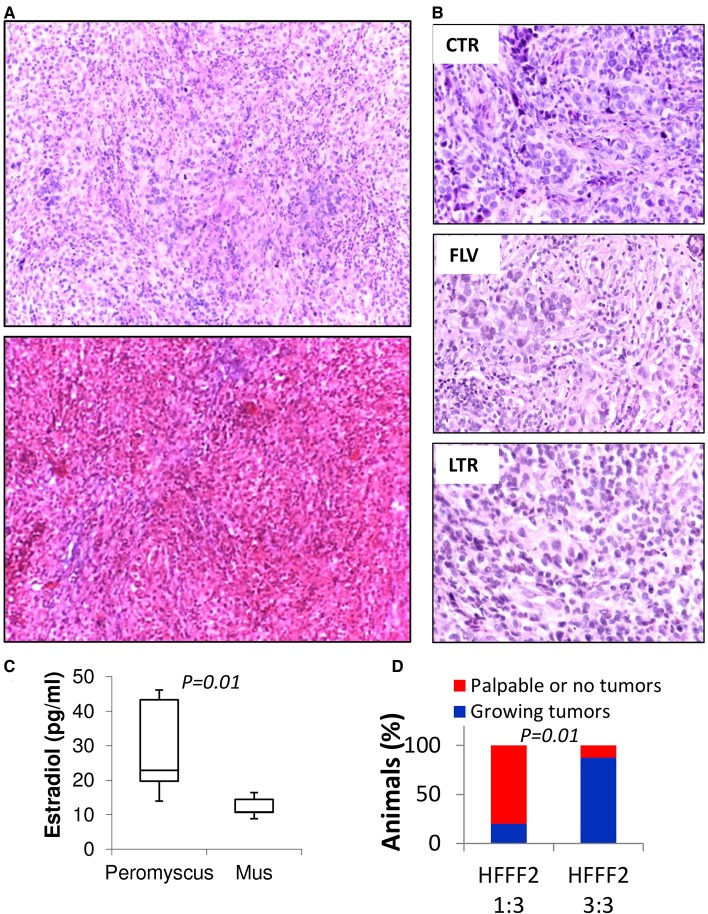
Fig. 4.
Histology of MCF7 tumors in P. californicus. (A) H&E (top) or trichrome (bottom)-stained sections of MCF7 tumors in P. californicus (magnification, 10×). (B) Comparison of H&E stained sections of MCF7 tumors treated with FLV, LTR or DMSO (magnification, 40×). (C) Estradiol levels in the plasma of eight P. californicus and five female SCID mice measured by ELISA (Cayman Chemical, MI). P values are indicated (Student's t-test). (D) Percentage of tumors growing in relation to the ratio of HFFF2 fibroblasts admixed with the MCF7 cells. Tumors were scored as positive when tumor volume reached at least 100 mm3 after 3 weeks.

