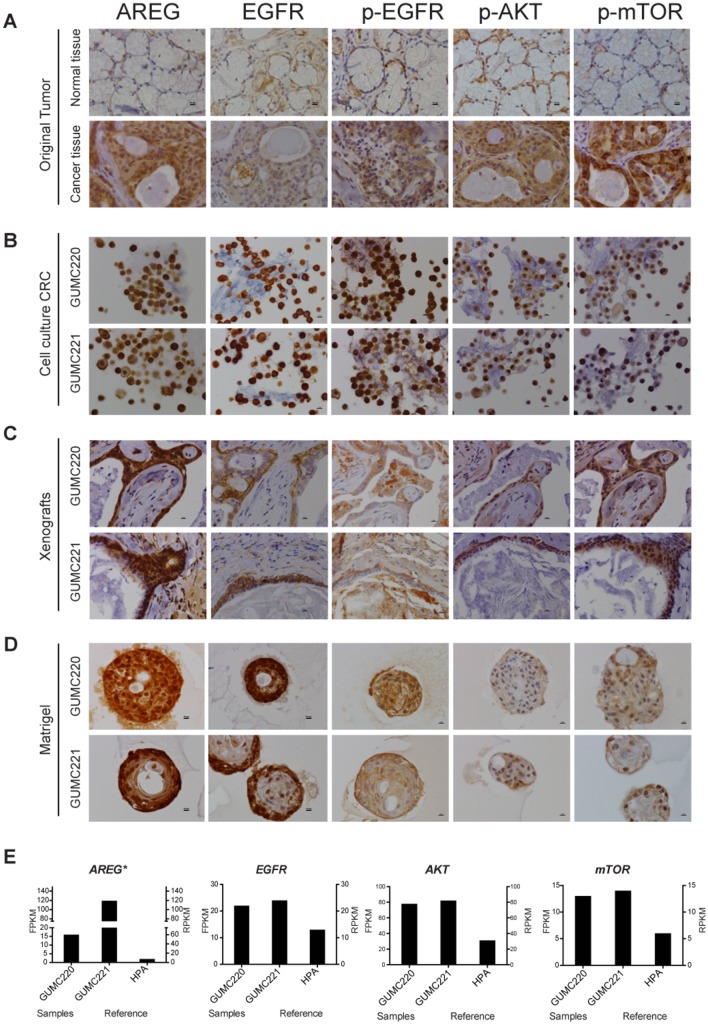
Fig. 4.
Evaluation of AREG, EGFR, p-EGFR, p-AKT and p-mTOR expression in original tumor and GUMC220/221 CRC cultures, xenografts and Matrigel cultures. (A-D) Representative IHC images for AREG, EGFR, p-EGFR, p-AKT and p-mTOR in adjacent normal tissue (top) and MEC (cancer tissue, bottom) (A), GUMC220 (top) and GUMC221 (bottom) cell pellets from CRC cultures (B), GUMC220 (top) and GUMC221 (bottom) xenografts (C), and GUMC220 (top) and GUMC221 (bottom) Matrigel spheroids (D). Images were taken at 40× magnification. Scale bars: 10 μm. (E) Left y-axis: relative FPKM values for AREG, EGFR, AKT and mTOR in GUMC220 and GUMC221. *P<0.05 (Cuffdiff). Right y-axis: for reference, relative RPKM reads for AREG, EGFR, AKT and mTOR from the HPA for normal salivary gland tissue.

