Fig. 6.
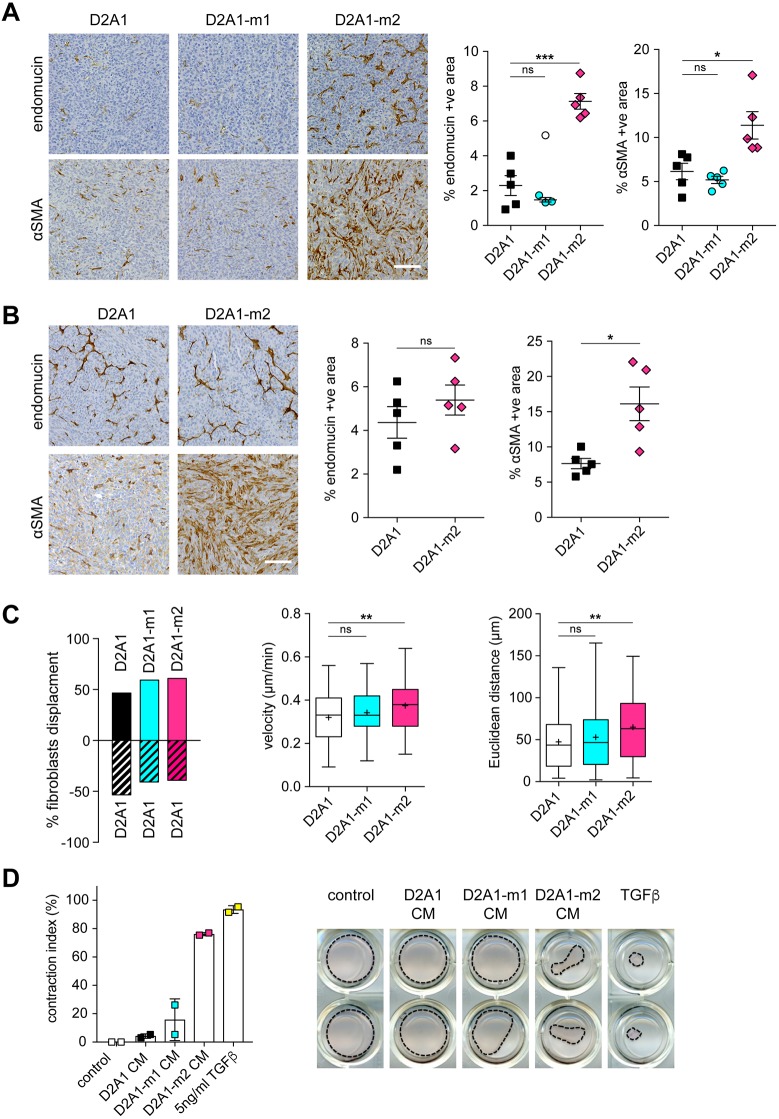
Stromal cell recruitment in primary tumours. (A,B) Primary tumours from the spontaneous metastasis experiments shown in Fig. 1B and Fig. 2 were sectioned and stained for αSMA or endomucin. (A) BALB/c mice from Fig. 1B; (B) NSG mice from Fig. 2. Representative images are shown (left). Scale bars: 100 µm. Quantification of staining from at least four tumours per group ±s.e.m. (n>6 fields of view per tumour) (right). Significant outlier is shown as a white symbol. (C) Competitive fibroblast attraction assay (see Fig. S4A for experimental set up). Migration of individual 3T3 cells towards D2A1 versus D2A1, D2A1 versus D2A1-m1, or D2A1 versus D2A1-m2, cells was monitored over 8 h (n>60 cells tracked/sample). Left panel: percentage net displacement of fibroblasts (see Fig. S4B for individual cell tracks and quantification). Middle and right panels: velocity (µm/min) and Euclidean distance (µm) of fibroblast migration. In box and whisker graphs, boxes extend from the 25th to 75th percentiles, middle lines are plotted at the median, whiskers are minimum and maximum, and+indicates the mean of data. (D) Fibroblast contraction assay. Data are % contraction of the fibroblast containing Matrigel/collagen gel after 14 days treatment with DMEM, TGFβ or conditioned medium from D2A1, D2A1-m1 and D2A1-m2 cells, with n=2 wells/condition. Representative images of the gels are shown (right). *P<0.05; **P<0.01; ***P<0.001; ns, nonsignificant.

