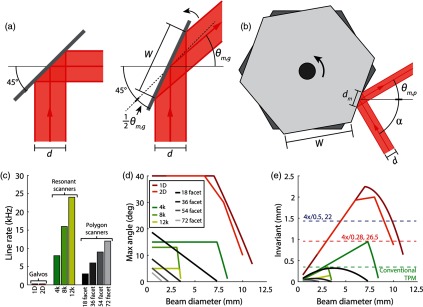
Fig. 3.
Evaluating performance of mirror scanners. (a) Diagram of galvanometer or resonant scanner with input beam diameter . Given and the clear aperture of the galvanometer , the maximum scan angle can be determined. (b) Diagram of spinning polygonal scanner with clear aperture , input beam diameter , beam footprint on the facet , and feed angle . (c) Line rate of galvanometer mirrors, resonant scanners, and polygonal scanners. Parts are listed in Appendix B. (d) Maximum scan angle of scanners plotted as a function of input beam diameter for the nine scanners calculated using Eqs. (12) and (15). (e) Optical invariant of scanners in isolation plotted as a function of input beam diameter to scanner. Curves are colored according to legend in (d). Also shown is the optical invariant of a conventional TPM system (dashed green line) and the two macro-objectives: XLFLUOR4X (dashed red line) and MVPLAPO 2XC (dashed blue line). Comparison of (c) and (e) demonstrates trade-off between speed and throughput.

