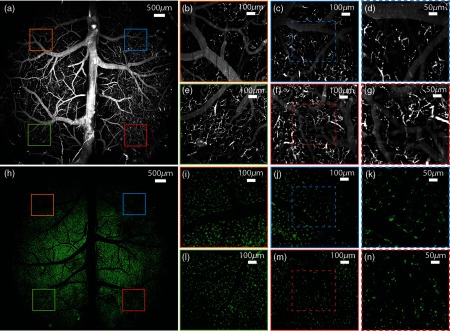
Fig. 9.
Cerebral vasculature and microglia imaged over the mouse cortex with LF-TPM. (a) Maximum projection image of cerebral vessels imaged with LF-TPM after tail vein injection of fluorescein-dextran. Dimensions of the box are . (b) FOV imaged 3-mm off axis at orange box shown in (a). (c) FOV imaged 3-mm off axis at blue box in (a). (d) FOV highlighted by dashed blue box in (c). (e) FOV imaged 3-mm off axis at green box shown in (a). (f) FOV imaged 3-mm off axis at red box shown in (a). (g) FOV highlighted by dashed red box in (f). (h)–(n) Same as (a)–(g), but for microglia imaged in .

