
Figure 2.
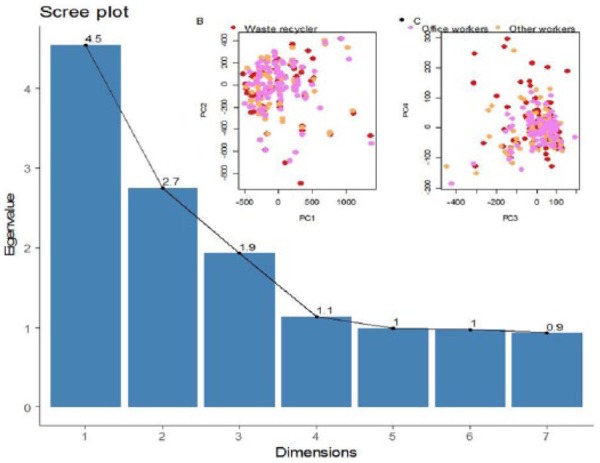
PCA-based analysis of data. (a) Scree-plot (b and c); PCA was applied to separation occupational class.
Official websites use .gov
A
.gov website belongs to an official
government organization in the United States.
Secure .gov websites use HTTPS
A lock (
) or https:// means you've safely
connected to the .gov website. Share sensitive
information only on official, secure websites.
PCA-based analysis of data. (a) Scree-plot (b and c); PCA was applied to separation occupational class.