
Fig. 3.
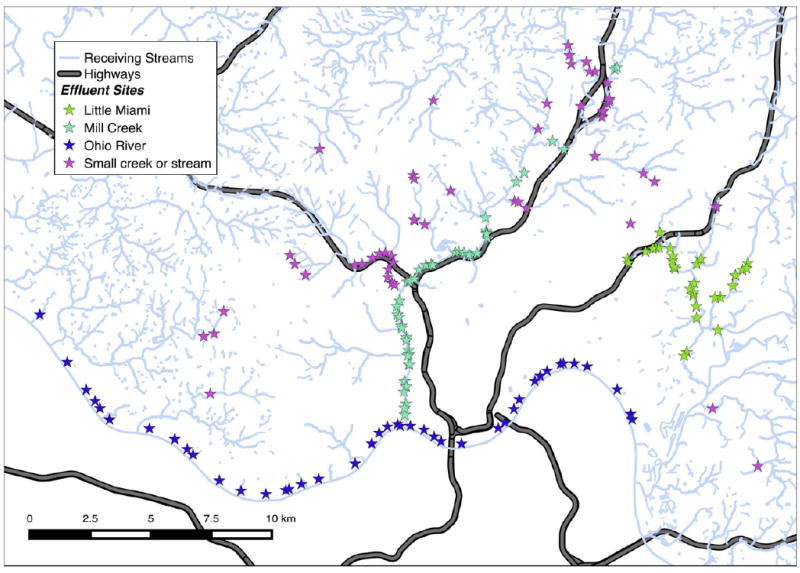
The study area of Cincinnati, Ohio, USA. The location of CSO effluent sites are represented by stars and the type of CSO effluent sites categorized by its receiving stream is are represented by the color of each star.
Official websites use .gov
A
.gov website belongs to an official
government organization in the United States.
Secure .gov websites use HTTPS
A lock (
) or https:// means you've safely
connected to the .gov website. Share sensitive
information only on official, secure websites.
The study area of Cincinnati, Ohio, USA. The location of CSO effluent sites are represented by stars and the type of CSO effluent sites categorized by its receiving stream is are represented by the color of each star.