
Fig. 5.
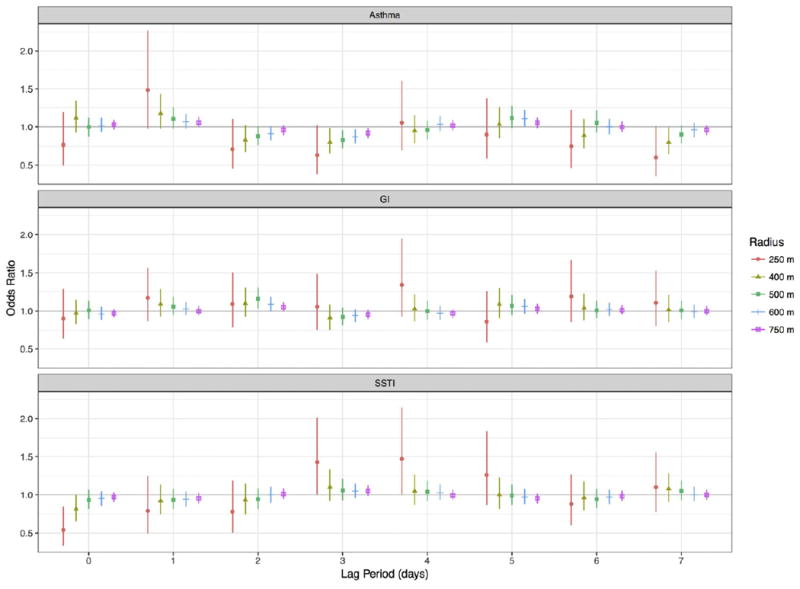
Odds ratios froma sensitivity analysis where the exposure assessmentwas repeatedwith buffer radii of 250, 400, 600, and 750min addition to the 500mused in the analysis. The resulting odds ratios and confidence intervals from the conditional logistic regression models are plotted.