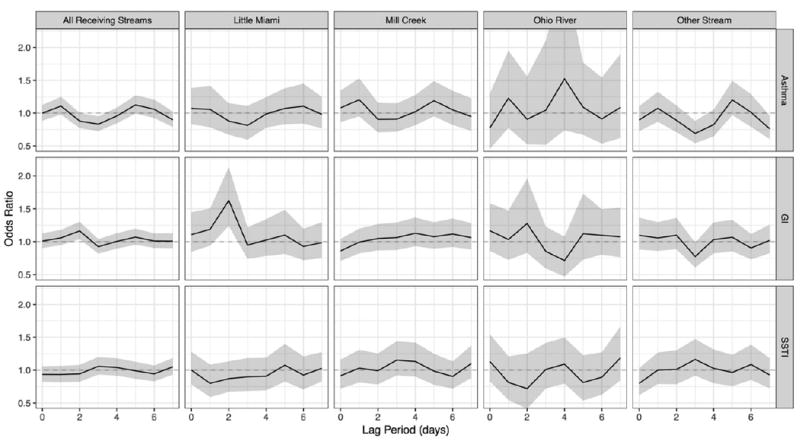
Fig. 6.

Each of the 171 effluent sites was classified as “Ohio River”, “Mill Creek”, “LittleMiami”, or “Other Stream” and an interaction term was added to the conditional logistic regression models to identify the effectmodification of the type of receiving stream on the odds of an ED visit due to an increase in one CSO event. To better illustrate the trends, the estimates at each lag period and their 95% confidence intervals are represented by a line and shaded band, respectively.
