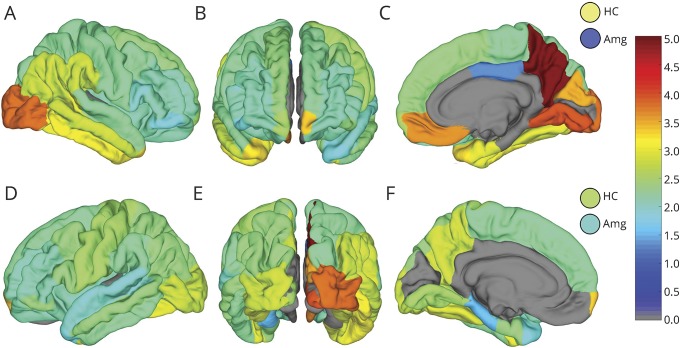
Figure 5. Non–seizure onset zone (SOZ) high-frequency oscillation (HFO) amplitudes across the Desikan-Killiany (D-K) atlas.
Map of mean HFO amplitude in microvolts of HFOs in non-SOZ channels in DK atlas brain regions shown from right (A) and left (D) lateral, anterior (B), right (C) and left (F) mesial, and posterior (E) perspectives. Hippocampus (HC) and amygdala (AMG) amplitudes in right and left hemisphere are shown by the circles in the top and bottom row, respectively. Atlas regions with fewer than 4 electrodes were excluded from analysis and are shown in gray.

