Figure 6.
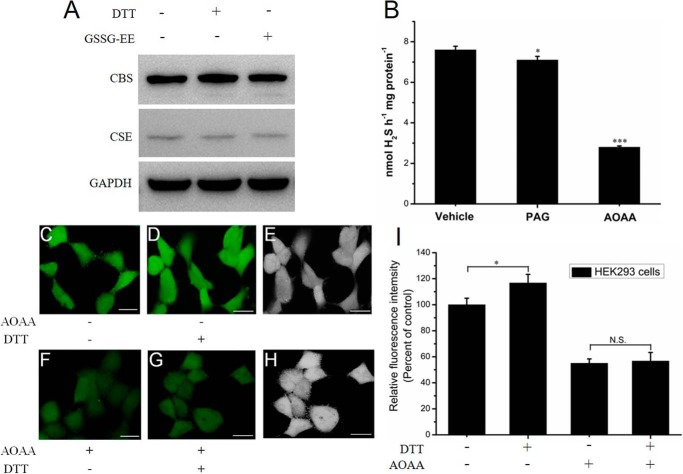
Increasing activity of CBS in its reduced state increases the H2S signaling in live HEK293 cells. A, HEK293 cells were exposed to 0.5 mm DTT or 0.5 mm oxidized GSSG-EE for 10 min. The cell lysates (50 μg) were resolved on SDS-PAGE and immunoblotted for CBS. B, H2S production was measured in HEK293 cells using the methylene blue method. The inhibitors 1 mm AOAA and 2 mm dl-propargylglycine (PAG) were used to inhibit CBS and CSE, respectively. The data are presented as the means ± S.D. (n = 3). *, p < 0.05; ***, p < 0.001 versus vehicle. C, HEK293 cells were incubated with 2 μm SF7-AM for 30 min at 37 °C, washed, and then imaged using confocal microscopy. D, the same dishes of cells shown in C were incubated with 0.5 mm DTT for 30 min at 37 °C and then imaged. E, brightfield images of the same dishes of cells shown in D. Scale bar, 25 μm. F, HEK293 cells were incubated with 0.5 mm AOAA for 24 h to inhibit CBS activity and were then washed. Subsequently, the cells were incubated with 2 μm SF7-AM for 30 min at 37 °C, washed, and then imaged. G, The same dishes of cells shown in F were incubated with 0.5 mm DTT for 30 min at 37 °C and then imaged. H, brightfield images of the same dishes of cells shown in G. Scale bar, 25 μm. I, quantification of the confocal fluorescence images of H2S signaling in HEK293 cells, with data from C, D, F, and G for comparison. The graph represents the relative fluorescence intensity compared with that of non-treated cells (C) and shows the means ± S.D. (n = 3). *, p < 0.05; N.S., not significant.

