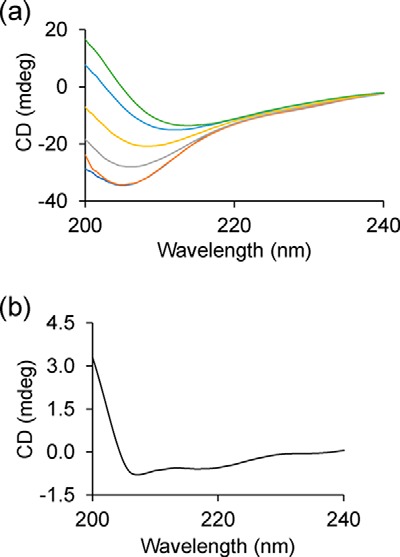
Figure 2.

Secondary structural changes during Httex1(Q46) aggregation monitored by CD. a, CD spectra of native, unlabeled Httex1 obtained at different time points (0 min, dark blue; 30 min, orange; 2.5 h, gray; 5 h, yellow; 10 h, light blue; 20 h, green). b, difference spectrum for the t = 0-min and t = 30-min time points shows α-helical character as judged by the peaks at 208 and 222 nm. The concentration was 15 μm. The data are given in millidegrees and were not converted to MRE, as the starting concentrations do not accurately describe the behavior during self-association and aggregation.
